


Many believe that, of brown and white sugar, brown is less damaging to health. Yet, experimental evidence on the question is scarce. Most of the related reports date from the 1960s and 1970s. Some people reach for brown sugar for its molasses flavour. Others choose it because they believe it’s less harmful.
The choice is made at scale. World sugar use reached 23.8 kg per person in 2009, up from 23.6 kg the year before. So even a small difference between the two sugars would be repeated across a great many spoonfuls.
The wider scientific argument about sugar dates from the same era. In 1970, the American biochemist Ancel Keys used his Seven Countries Study to blame saturated fat for rising heart disease. Two years later, the British nutritionist John Yudkin blamed sugar instead, in a book titled ‘Pure, White and Deadly’. The fat explanation won. As a result, many national dietary guidelines featured low-fat advice for about four decades.
Then the blame shifted. In 2004, an ecological study (comparing whole populations rather than individuals) showed overweight and obesity rising in parallel with fructose-containing sugars in the United States. Fructose is one of the two simple sugars that make up table sugar. Such studies provide relatively weak evidence because patterns observed across populations do not necessarily apply to the individuals within them. They suit generating ideas, not proving causes.
Even so, sugar returned to the spotlight. A 2009 lecture titled ‘Sugar: The bitter truth’ passed six and a half million views on YouTube. Editorials, books and documentaries followed, describing fructose-containing sugars as toxic. Some commentators went further, comparing sugar to tobacco.
Research has not settled the argument. Nutrition scientists are split on whether these sugars cause disease. Meanwhile, money has inflamed the dispute. The authors of an influential review that downplayed sugar’s harms decades ago did not disclose their links to the sugar industry.
The evidence base itself has another problem. A 2023 umbrella review (a review of other reviews) examined 73 meta-analyses, which pool the results of many studies. Firm conclusions about sugar’s health effects still proved hard to reach. Weak study designs, differing ways of measuring intake and inconsistent definitions of sugar all stood in the way.
At the centre is a question evidence cannot fully answer. Does fructose harm the body in some special way? Or does any harm come from the extra calories sugar supplies? For brown sugar, the question goes a step further. Whatever separates it from white sugar has to come from the molasses that colours it.
Following that molasses means tracing sugar from cane fields and beet farms to the bloodstream, then into long-term research. Along the way, colour proves a poor guide to where a sugar came from or how it was made. A difference on a nutrition label also has to hold up at the scale of an ordinary teaspoon. Research that directly compares brown and white sugar is far more limited than the certainty with which claims about them are made.
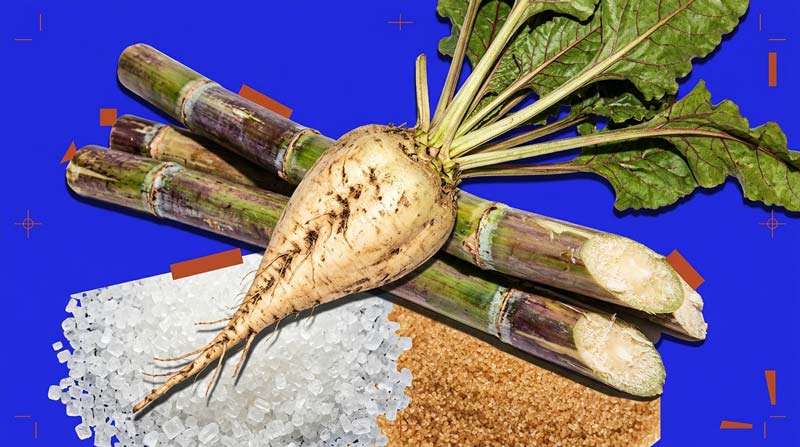
Where Brown and White Sugar Come From
Sucrose, the chemical name for table sugar, is one glucose molecule bound to one fructose molecule in a 50:50 ratio. Glucose and fructose are monosaccharides (single sugar units) and contain the same atoms. They differ only in how those atoms are arranged. Fructose has a keto group, while glucose has an aldehyde group, two different carbon-and-oxygen chemical groups. Small as it looks, that difference makes the body handle the two sugars very differently.
The sucrose in brown and white sugar is the same molecule that green plants make everywhere. Leaves capture energy from sunlight and use it to build sucrose from carbon dioxide and water, a process called photosynthesis. In fact, sucrose is the main carbohydrate in plants, just as glucose is in animals. Many fruits, nuts and vegetables contain it, some at up to 10%.
Sugar beet and sugar cane hold far more: roughly 16% and 12 to 14%, respectively. That concentration makes them the most efficient plants for growing and extracting sugar. According to the Sugar Association, the sucrose they yield is identical to the sucrose in peaches, almonds, and sweet peas.
Cane supplies most of it. In 2020, more than 120 countries produced sugar, with nearly 80% coming from sugar cane and the rest from sugar beet. Yet the two plants grow, store and surrender their sugar in very different ways:
- Sugar Cane: A tropical grass that grows 10 to 20 feet (about 3 to 6 metres) tall. It is perennial, so after harvest it is cut just above the roots and sprouts again, ready to cut once more within 10 to 12 months. Particular enzymes in its tissues build up large amounts of sucrose in the stalk. Brazil, Cuba, Mexico, India and Australia are among its main growers. Sugar cane is produced in greater volume than any other crop, with about 1.87 billion tonnes harvested in 2020.
- Sugar Beet: A white-fleshed member of Beta vulgaris, the same species as red table beetroot. Its leaves make the sugar, while its root, 15 to 35 cm long and almost entirely buried, stores it. Farmers sow it in spring and lift it in autumn or early winter of the same year. Left in the ground, the plant would spend its second year using that stored sugar to produce seed. Unlike cane, it does not thrive in the tropics, so people grow it in temperate countries across Europe, as well as the United States, China, Japan, Chile, Morocco, and Egypt.
Cane has a far longer history. People first domesticated it around 8000 BCE in New Guinea. By contrast, the German chemist Andreas Marggraf identified sugar in beet roots in 1747. Within little more than a century, beet had replaced cane as the main source of sugar in continental Europe.
What leaves the factory erases the difference between the two plants. According to the Sugar Association, beet and cane purification follow a similar process and produce the same pure sucrose. In its purest form, that sucrose is white or clear. Genetics leaves no trace either. Refined sugar contains no DNA or protein, only sucrose. Hence, sugar from genetically modified beet is identical to sugar from standard beet.
That has a direct consequence for anyone choosing between brown and white sugar. A white crystal does not reveal whether it grew in a tropical cane field or a European beet field. Nor does a brown one, because processing determines its colour. Cane juice, for example, is the raw material for refined white sugar. Yet, the same juice also yields brown sugar, molasses and jaggery. It also contains modest amounts of plant compounds, mainly phenolic acids and flavonoids (two families of natural antioxidants). Where those compounds end up depends on what the factory does next.
How Molasses Is Removed, Retained or Added
A sugar factory’s centrifuge spins at 1,000 to 2,800 revolutions per minute. Inside it, a perforated metal basket holds a dense paste of syrup and sugar crystals. The syrup is flung out through the holes, while the crystals stay behind. That syrup is molasses, and what happens to it draws the line between brown and white sugar.
Reaching that moment takes five main stages, broadly shared by cane and beet:
- Extraction: Cane is shredded or crushed, sprayed with hot water, and pressed through five mills. These squeeze the juice away from the fibrous residue, called bagasse. Beet is sliced into thin strips called cossettes, smaller than chips, and soaked in hot water flowing the opposite way. Much like tea brewing in a pot, the sugar passes from the strips into the water. The first cane juice is dark green, acidic and cloudy.
- Clarification: The juice is cleaned of non-sugar material. Cane juice may first meet rising sulphur dioxide gas in towers 10 to 20 metres high, which lightens its colour. Next, the juice is heated, mixed with a lime slurry, and often bubbled with carbon dioxide. Impurities settle into a sludge that is filtered away, a process that usually takes several hours.
- Concentration: The clear juice boils through a chain of vacuum evaporators, each at a lower pressure than the last. As a result, the syrup boils at progressively lower temperatures. It leaves as a thick, nearly colourless syrup of 50 to 65% sugar.
- Crystallisation: In a vacuum pan, the syrup is seeded with tiny sugar grains that draw sucrose out of solution. As water evaporates, the crystals grow into massecuite, a dense paste of syrup and crystals.
- Separation: The centrifuge spins the massecuite; molasses passes through the basket, and water washes the crystals as they spin. Recovering the most sucrose takes about four extraction rounds. Finally, the crystals are dried to a moisture content as low as 0.02% and sorted by size.
Beet and cane part company at the end. Sugar beet is usually turned into white sugar at a single factory. Cane, by contrast, typically passes through two facilities. A raw sugar mill produces raw sugar, an intermediate product that is not food grade because it still contains molasses and impurities.
A refinery then melts that raw sugar, filters out the remaining impurities and colour, and crystallises it again. Depending on the plant, refiners may remove colourants with phosphoric acid, lime and carbon dioxide, or filters. They often finish with a bed of activated carbon or bone char.
Molasses is what all this effort separates out. It is the thick, dark syrup left over from crystallisation, and it still contains about 50% sugar: the sucrose that would not crystallise. The final, most exhausted form from sugar refining is called blackstrap molasses.
Molasses also carries what the crystals leave behind. It holds more phenolic acids than other sugar cane products, such as ferulic and vanillic acid. It is also rich in flavonoids and shows stronger antioxidant activity (the capacity to neutralise reactive, damaging molecules). In one comparison, molasses contained about twice the phenolic content of fresh cane juice. It measured 196 mg of gallic acid equivalents per 100 g of extract, compared with 93 mg in the juice. Gallic acid equivalents are a standard unit for measuring these compounds.
Heat changes it on the way. Sucrose made up 66% of the identified compounds in fresh cane juice but 59% in molasses. Some acids, such as lactic and acetic acid, form during heating, while others, such as aconitic acid, come from the cane itself. Colour has several sources. Cane juice owes its colour to plant pigments, polyphenols (plant compounds including phenolic acids and flavonoids), caramels, and products of sugars reacting with amines.
Molasses decides colour. According to the Sugar Association, a sugar’s colour depends mainly on how much molasses remains on its crystals or is added back to them. Every sugar product on the market differs only in crystal size or molasses content. More molasses means more colour, flavour, and moisture.
Removing molasses completely produces white sugar. Each centrifuge round strips more away, and refining finishes the job. Heavy refining sharply reduces polyphenols and strips out most minerals, which is why refined white sugar has the lowest levels of every essential mineral among the cane sugars compared. Intense boiling and concentration during processing carry the plant compounds with them.
Retaining molasses is the second route. Brown sugars can form in the late stages of refining, when fine crystals carry a significant molasses content. Demerara can be made by extracting and crystallising cane juice directly. Refiners produce muscovado at an early stage of refining, before molasses is removed. Beet syrup yields a soft brown sugar known in French as vergeoise. Because lighter processing leaves more cane in the sugar, these sugars retain some phenolic acids and flavonoids.
Adding molasses back is the third route. White refined crystals are coated with cane molasses syrup, and light and dark brown sugars are made by mixing white sugar with different amounts of molasses. Brown sugar is usually made by adding molasses, which gives it its colour. For these sugars, the difference between brown and white sugar comes down to a molasses coating on the same white crystals.
A fourth path skips the centrifuge entirely. Noncentrifugal sugar is made by boiling cane juice until it thickens and crystallises, with little or no refining. It is not bleached, filtered or chemically treated, so it never meets sulphur dioxide, phosphoric acid, lime or activated carbon. All of its molasses stays in, along with more minerals, vitamins, and other plant matter from the original juice.
The refinery wastes very little of what it removes. Molasses goes to bakers, distillers, rum makers, yeast producers and animal feed. Cane bagasse often powers the mill, and some mills even supply electricity to nearby towns. Beet pulp becomes animal feed, and producers spread the mud filtered from the juice on fields as fertiliser.
Producers refine sugar for consistency and quality. Producers dry white refined sugar to prevent clumping, and its small crystals suit bulk handling without caking. Purity also protects flavour and processing. In unrefined sugar, high ash content (the mineral residue left after burning) reflects high potassium, which can give sugar an unpleasant taste and hinder crystallisation. For that reason, unrefined sugar’s ash content should not exceed 2.2%.
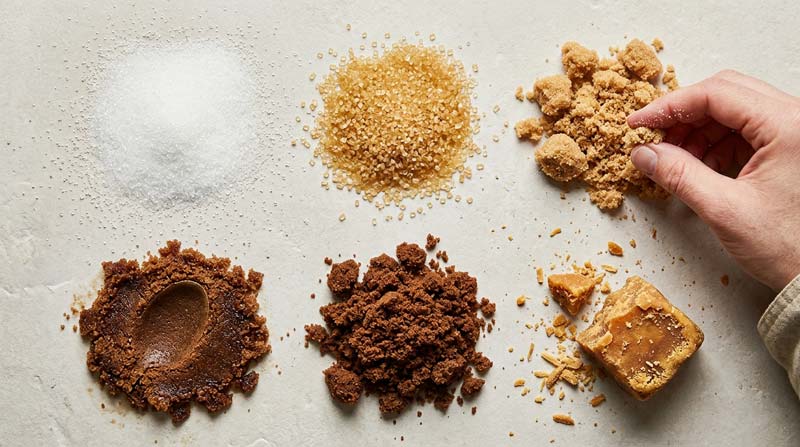
Why Brown Sugar Comes in Different Forms
Three established sources define demerara sugar in three different ways:
- The Food and Agriculture Organization describes it as sugar obtained by extracting and crystallising cane juice directly.
- The Sugar Association treats it as another name for turbinado, a partially processed sugar.
- The Institute of Food Technologists calls it a light brown sugar with large crystals coated in molasses.
The confusion has a cause. All sugar starts as juice from beet or cane. Small adjustments to how that juice is cleaned, crystallised and dried then create different varieties. So does how much molasses each sugar keeps. Crystal size adds another layer, giving each sugar functional traits that suit particular foods and drinks. Some types never reach supermarket shelves at all and are sold only to the food industry. Beyond brown and white sugar, the range includes caster, cube, icing, candy and preserving sugar, each with its own taste and uses.
Moisture separates the forms further. Brown sugars hold more of it than white sugars, which is why they tend to clump. Higher moisture also encourages crystals to dissolve and invites biochemical breakdown and microbial spoilage. It also forms hard lumps known as cobblestones, and all of these shorten shelf life. Crystal size varies just as widely. A grain of ordinary granulated sugar measures about 0.5 mm across, while icing sugar is ground to 0.024 mm.
Soft Light and Dark Brown
These fine, moist sugars pack into a spoon. Both contain molasses, in different amounts. Dark brown sugar has a deeper colour and stronger flavour than light brown because it contains more molasses. Their fine crystals and extra moisture give them a soft, clumping texture.
Demerara and Turbinado
Turbinado, sometimes sold as demerara or raw cane sugar, is a partially processed sugar that keeps more of the naturally present molasses. It has a blond colour, a mild brown sugar flavour and larger crystals than the brown sugar used in baking. It is the sugar inside packets labelled ‘raw cane sugar’. According to the Sugar Association, it has been processed just enough to make it safe to eat.
Muscovado
Muscovado, also known as Barbados sugar, is an unrefined cane sugar from which the molasses has not been removed. As a result, it is very dark brown and has a particularly strong molasses flavour. Its crystals are slightly coarser and stickier than regular brown sugar, giving it a sandy texture.
Jaggery, Panela and Other Whole Cane Sugars
Noncentrifugal sugar, also called whole cane sugar, is made from concentrated cane juice and has long been used in most cane-growing regions. Its names change with the map. It is jaggery in India, panela in Colombia, rapadura in Brazil, kokuto in Japan and gula Melaka in Malaysia. In the Philippines, the same product is called muscovado. In Europe and North America, it is called brown sugar. White sugar remains the most widely used sugar worldwide, but these unrefined alternatives are now on the market.
What ‘Raw’ and ‘Unrefined’ Mean
The word ‘raw’ means different things depending on who uses it. Technically, raw sugar is a yellow-to-brown intermediate product in white sugar manufacturing. It undergoes minimal chemical processing. The Sugar Association describes raw sugar from a cane mill as not food grade, because it still contains molasses and impurities.
The Institute of Food Technologists likewise describes ‘true raw sugar’ as a soft brown sugar that still contains impurities. It keeps that apart from turbinado-style sugar sold as ‘Sugar in the Raw’. On a shop shelf, ‘raw’ describes a partially processed sugar such as turbinado, because true raw sugar isn’t food grade.
The term ‘unrefined’ is equally broad. It covers muscovado, whole cane sugars made with little or no refining, and minimally refined brown sugar. The last is a cane brown sugar made in food-grade mills through washing, extraction, minimal refining, crystallisation, drying and packaging. Because it undergoes fewer steps, it retains some naturally occurring trace minerals, such as calcium, magnesium, and potassium.
It also keeps some vitamins, amino acids, antioxidants and other plant compounds. Meanwhile, the Food and Agriculture Organization uses ‘natural sugars’ for something else entirely: the unrefined sugars inside fruit, grains and vegetables. The same words on brown and white sugar packets can therefore describe very different products in different markets.
What Brown and White Sugar Contain Gram for Gram
Per 100 g, brown sugar carries slightly fewer calories than white sugar: 380 kcal against 387 kcal. Kcal, or kilocalories, are the calories shown on food labels. Most of that gap is water. Brown sugar holds 1.34 g of water per 100 g, while white sugar holds 0.02 g. Its sugars also differ slightly: 94.6 g of sucrose, plus small amounts of free glucose and fructose. White sugar, by contrast, is 99.8 g of sucrose. Neither contains fibre or fat.
Placed side by side in the US Department of Agriculture’s food composition data, brown and white sugar are nutritionally very close; see the table below:
The spoon distorts the calorie picture. A packed teaspoon of brown sugar weighs 4.6 g, whereas a level teaspoon of white sugar weighs 4.2 g. As a result, a packed spoonful of brown sugar has about 17 kcal, one more than white sugar. Spooned loosely, the same teaspoon of brown sugar weighs just 3 g. Packing, in other words, changes the numbers more than the sugar itself.
Brown sugars also vary among themselves. A commercial brown cane sugar bought in Serbia for a baking study was 99.19% sucrose, almost indistinguishable from white. Typical brown sugar sits at about 95%. At the other end, noncentrifugal sugars such as jaggery and panela are about 76.5-89.5% sucrose. They hold 3 to 7% molasses by weight. They also carry small amounts of glucose, fructose, water, amino acids, minerals, vitamins and polyphenols.
In relative terms, the mineral gap between brown and white sugar is wide. Brown sugar carries about 80 times the calcium of white sugar and more than 60 times the potassium. Those extra minerals come from the molasses. One Malaysian study compared white, brown and minimally refined brown cane sugars. Refined white sugar held the lowest amount of every essential mineral. Mineral content rose with ash content (the mineral residue left after burning), and selenium appeared only in the minimally refined sugar.
Vitamins barely register. In the same Malaysian analysis, B vitamins in both white and brown cane sugars sat below the level laboratory tests could quantify. Noncentrifugal sugars sit in a different league. Their total minerals range from 32.5 to about 1,000 mg (milligrams) per 100 g. Refined sugar holds 1.95 to 81.2 mg. They can also contain vitamin E, niacin (vitamin B3), vitamin C, and vitamin D2, whereas refined sugar contains no detectable vitamins. Their mineral content shifts with cane variety, soil, fertiliser, climate, harvesting and processing.
Antioxidant compounds follow the molasses too. Total phenolic content measured 0.004 mg gallic acid equivalents per gram in refined sugar. Light brown sugar measured 0.38 mg, dark brown 0.42 mg and raw brown sugar 0.58 mg. Antioxidant activity tests rank the sugars in the same order, with refined at the bottom and raw brown at the top.
Those measurements carry a caveat, however. Sugar itself can intensify the colour change that the standard phenolic test relies on. The amounts measured also depend heavily on the extraction method used. Even with that in mind, the totals stay small. Minimally refined brown sugar, the richest cane sugar compared, held fewer antioxidants and nutrients than other sugar alternatives.
A teaspoon is where those differences meet daily life. Adults aged 19 to 64 need 700 mg of calcium a day, according to UK government recommendations. A packed teaspoon of brown sugar provides about 0.55% of that. It also supplies about 0.17% of the day’s potassium, 0.15% of magnesium and 0.2 to 0.4% of iron. A teaspoon of white sugar provides close to none of any of them.
Reaching the full daily amount from brown sugar alone would take about 843 g, or roughly 183 packed teaspoons. Those teaspoons would also deliver around 3,200 kcal. The UK limit for free sugars is 27 g a day for women and 33 g for men. Free sugars are those added to food and drink, plus those in honey, syrups and fruit juices. The limits equal roughly six to seven packed teaspoons of brown sugar. Eaten right up to that limit, brown sugar would supply about 3 to 4% of daily calcium. It would add about 1% of potassium and 1 to 3% of iron.
Frequency changes the arithmetic for antioxidants. In Spain, refined sugar consumption runs at about 340 g per person per month. Replacing it with unrefined sugar could raise antioxidant intake. Estimates run from 1.4 to 9.1 mmol TE a month, depending on the sugar. That unit, millimoles of Trolox equivalents, is a standard measure of antioxidant activity. Blackberries have a far higher antioxidant capacity. Yet they contribute negligibly to the Spanish diet because people eat them so rarely. People eat sugar so often that small differences per spoonful can add up over a month.
What Happens When You Eat Brown and White Sugar
In the small intestine, an enzyme called sucrase quickly splits sucrose into its two building blocks, glucose and fructose. From that moment on, the body no longer encounters sucrose. No matter what colour the sugar is on the spoon, both sugars reach the gut wall as the same two simple sugars.
Fructose then takes its own route. It enters the gut lining cells through GLUT5, a transport protein dedicated to fructose. That step needs no energy and no sodium. It leaves those cells through a second transporter, GLUT2, and passes into the blood. This happens the same way whether the fructose comes from pure fructose, sucrose, or high-fructose corn syrup.
Company matters, though. Fructose eaten alone can overwhelm the intestine’s capacity to absorb it, leading to digestive distress. Eaten together with glucose, as in sucrose, it is absorbed far more completely. Because both are mostly sucrose, brown and white sugar always deliver fructose alongside glucose.
Absorbed sugar first travels to the liver through the portal vein (the vessel that carries blood from the gut to the liver). In healthy people, the liver takes up anywhere from a third to about 60% of the glucose eaten, depending on the study. Skeletal muscle and the brain take most of the rest. How much glucose enters liver cells depends mainly on how high blood glucose rises, not on insulin (the hormone that helps move glucose from the blood into cells).
After a mixed meal, the liver also reduces its own glucose release. It does this mainly by stopping the breakdown of glycogen (the body’s stored form of glucose). A rise in insulin and falling glucagon (a hormone that raises blood glucose) drive the switch. The liver’s main use of incoming glucose is to store it. In healthy people, about half the glucose eaten after a meal is stored as glycogen.
That store has a ceiling. Once liver glycogen is full, further storage is held back. Beyond that point, the body burns more carbohydrate and less fat. The liver also turns surplus glucose into fatty acids, a process called de novo lipogenesis (the liver making new fat). In healthy people, overfeeding glucose or sucrose similarly raised liver fat production.
Fructose is handled differently from glucose. The small intestine breaks down much of it first, and high doses overwhelm that capacity, so the excess spills on to the liver. There, the enzyme ketohexokinase converts fructose into fructose-1-phosphate. When excessive amounts arrive, this step can drain the cell’s ATP (its energy currency), and the leftovers are broken down into uric acid. Fructose also does not stimulate insulin release the way glucose does. In addition, it is a more powerful trigger than glucose for switching on the liver’s fat-making genes.
However, the scale of that fat-making in people is small. In the human liver, about 50% of a fructose load becomes glucose, 25% becomes lactate, and about 15% becomes glycogen. Tracer studies follow labelled molecules through the body. They put the share of fructose turned into fat at less than 1% at moderate intakes, and up to 5% with overfeeding.
In mouse livers, about 30% of fructose typically becomes fat, rising beyond 50% with overfeeding. Much of the biochemical case against fructose comes from rodent experiments. The rest leans on human studies that fed large amounts of pure fructose, without the glucose it normally arrives with.
How far blood glucose rises after eating depends on more than the sugar itself. The type of carbohydrate, the amount eaten and the rest of the meal all play a part:
- Glycaemic Index: The glycaemic index (GI) ranks foods by how much they raise blood glucose, with glucose set at 100. Foods scoring 55 or less are classed as low GI, and 70 or more as high. On that scale, sucrose scores 65 and fructose just 14. Sucrose sits between the two thresholds because half of it is fructose, which barely moves blood glucose.
- Dose and Glycaemic Load: Glycaemic load (GL) adds portion size. It multiplies a serving’s available carbohydrate by the food’s GI and divides by 100. A teaspoon and a large dessert made with the same sugar therefore carry very different loads.
- The Rest of the Meal: Other foods eaten alongside sugar change the response. Small doses of fructose (7.5 to 10 g) have lowered the rise in blood glucose after high-GI foods such as mashed potatoes. That held in people with and without type 2 diabetes. That ‘catalytic’ effect has not been reliably reproduced in double-blind randomised trials, however.
Two human studies put versions of brown and white sugar side by side for the immediate response. In 1987, researchers in Madras, India, gave 18 adults with type 2 diabetes 300-kcal servings of glucose, cane sugar, honey, and jaggery on separate occasions. Blood glucose rose most after glucose, followed by jaggery, cane sugar and honey. At one hour, jaggery raised blood glucose significantly more than cane sugar or honey. By two hours, however, the three no longer differed significantly.
Their glycaemic indices, with glucose at 100, were 87.4 for jaggery, 83.9 for cane sugar, and 78.8 for honey. That score for cane sugar sits well above the 65 listed for sucrose, because GI values for the same food vary from one study to another. The researchers concluded that the three sweeteners can all raise blood glucose similarly. On that basis, the researchers could not recommend either honey or jaggery to people with diabetes as an alternative to sucrose.
The second study, from Malaysia in 2022, was smaller and more recent. It was a randomised crossover trial, in which each person tried every option in turn. Fourteen healthy adults ate jelly made with minimally refined brown sugar on one occasion and granulated white sugar on another. The brown sugar jelly produced a significantly higher total antioxidant capacity in the blood. It also led to lower levels of the satiety markers peptide YY and C-peptide, and of the hormone glucagon.
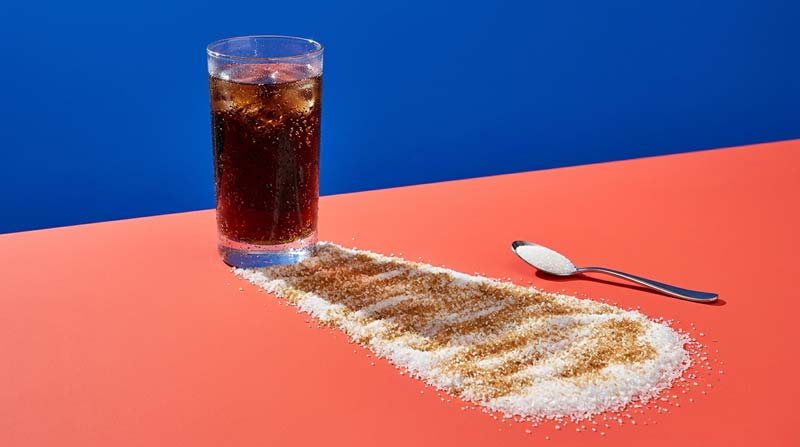
What Research Reveals About Sugar and Long-Term Health
Of 83 health outcomes examined across 73 meta-analyses of dietary sugar, 58 concerned sugar-sweetened beverages (drinks with sugar added before sale). Just four concerned sucrose itself. Most of the evidence was observational and rated low or very low quality. None of it reached the highest grade.
Both brown and white sugar are mostly sucrose, and the body splits both into glucose and fructose. Research on sucrose, added sugars, and fructose-containing sugars therefore applies to both. Research that separates brown and white sugar is another matter, and far rarer.
Sugary drinks also bring complications of their own. People who drink them more often tend to eat more total fat, saturated fat and sodium. They also eat less fruit, fibre, dairy and wholegrain food. On top of that, they smoke and drink alcohol more often, and they exercise less. Cohort studies (which follow large groups over time) adjust for these factors. Even so, some confounders, the other influences that travel alongside the one being studied, are always measured imprecisely or missed.
Most cohort figures are relative risks. A 12% higher risk means 12% above the comparison group’s own risk, whatever that starting level was. Controlled trials offer a more rigorous way to investigate because they can set the calories. Some swap sugar for other carbohydrates while holding calories equal. Others add sugar on top of a normal diet, supplying extra calories. Across those trials, harm tends to appear when fructose-containing sugars add excess calories. It largely disappears when they replace other carbohydrates at equal calories.
Blood Glucose Control
Long-term control is tracked through HbA1c (glycated haemoglobin, a marker of average blood glucose over recent months). It differs from the brief rise after a meal. Across 155 controlled trial comparisons in 5,086 people with and without diabetes, fructose-containing sugars lowered HbA1c slightly, by 0.22%. This occurred when the sugars replaced the same calories from other foods, mainly refined starches.
Fruit drove most of the benefit. Even so, the fall sits below the 0.3% threshold that the US Food and Drug Administration treats as clinically meaningful for new diabetes drugs. The trials were small and short, with median follow-up of 4.5 to 12 weeks. Most of the evidence was rated low quality.
When added to the diet as extra calories, the picture changed. Sugar-sweetened beverages raised fasting blood glucose by 0.12 mmol/L (millimoles per litre, the standard unit). Fruit juice raised it by 0.29 mmol/L. Whole fruit had no effect. At very high doses, fructose impairs insulin sensitivity and raises HbA1c. For sucrose and high-fructose corn syrup, the effect again follows the calories. Swapped for starch at equal calories, they lowered HbA1c, whereas extra calories from them raised fasting insulin.
Fruit’s advantage may come from its low glycaemic index and its fibre. Pectin in fruit forms viscous gels that may slow stomach emptying and sugar release. A lower glycaemic index blunts post-meal peaks. Fasting glucose, however, depends more on insulin sensitivity, so smoothing the peaks does not automatically improve the fasting reading.
For long-term glucose control, direct comparisons between the two sugars come from animal studies. Rats drank water containing 30% brown or refined sugar for six months. Their blood glucose did not change with either sugar at two, four or six months. Brown sugar contains about three times the chromium of refined sugar, 0.064 against 0.02 mg/kg. Chromium has improved glucose use in rats. That raised the idea that refining might weaken glucose control. The six-month comparison found no glucose difference to support it.
Weight Gain and Obesity
Prospective cohort studies tracked new cases of obesity among 56,579 adults. Each extra 250 mL a day of sugar-sweetened beverages was linked with a 12% higher risk. The link held after accounting for total energy intake and physical activity. Children who drank more of these drinks had a 55% higher risk of obesity than children who did not.
Controlled trials isolate the role of calories. The World Health Organization (WHO) commissioned an analysis of those trials. Across 13 trials in 144 adults, swapping fructose-containing sugars for other carbohydrates at equal calories did not change body weight.
By contrast, adding the same sugars as extra calories consistently caused weight gain across 10 trials in 382 adults. In adults who eat freely, raising sugar intake, mostly through drinks, added 0.75 kg on average. In trials lasting more than eight weeks, the gain reached 2.73 kg. Cutting free sugars led to an average loss of 0.80 kg.
Removal has proved less reliable than addition. Swapping sugary drinks for water or diet drinks has not consistently produced weight loss. In the CHOICE trial, for example, cutting calories from sugary drinks produced no more weight loss at six months than general weight-loss advice. One explanation is compensation: people may eat more of other foods or use less energy.
Researchers are often answering two different questions. One asks whether a high-sugar diet causes more weight gain than a low-sugar diet with the same calories. The other asks whether people who eat freely on a high-sugar diet end up eating more and therefore gain more. In the first, total energy intake is a confounder to strip out. In the second, it is the very route by which sugar would cause weight gain.
Appetite sits at the centre of that second question. Sugar in drinks fills people up less than the same calories in solid food. Fructose does not stimulate insulin or leptin (a hormone that signals fullness). Nor does it suppress ghrelin (a hormone that signals hunger). In young healthy adults, a fructose drink produced greater brain reactivity to food cues and more hunger than a glucose drink. Yet only one sustained trial has compared the two forms. People who consumed 25% of their energy as sugary drinks for four weeks ate more than when they ate jelly beans. Their weight gain did not differ significantly.
Two rat studies compared the two sugars directly, and they split. Over 42 days, high daily doses of either sugar increased body weight compared with saline. White sugar caused significantly greater weight gain. Over six months, neither sugar changed body weight compared with plain water. Both, however, nearly doubled the fat stored around the abdominal organs, with no difference between them.
Insulin Resistance and Type 2 Diabetes
Across 16 cohort studies, each extra daily serving of sugar-sweetened beverages was linked with a 27% higher risk of type 2 diabetes. UK Biobank followed 120,343 participants for 8.4 years. Among them, a dietary pattern high in added sugars was associated with a 9% higher rate of the disease.
Sucrose itself points the other way. Across six prospective cohorts, each extra 25 g of sucrose a day was linked with an 8% lower risk of type 2 diabetes. Total sugars and fructose showed no link. That evidence was rated very low quality. The likely explanation lies in where sucrose comes from. More of it comes from solid foods such as grains, fruit, and sweetened dairy than from drinks. Several of those foods also show beneficial links. Yoghurt and even ice cream have been linked with a lower risk of type 2 diabetes. That does not mean ice cream protects against it.
Energy explains much of the drink signal. Its effect on diabetes risk weakened once researchers accounted for body fat, a proxy for high-calorie intake. Links between sugary drinks and cardiometabolic disease (conditions of the heart, blood vessels and metabolism) appear mainly at extreme intakes. Typically, that means one to two or more servings a day compared with none. At moderate intakes, around the global average of 0.58 servings a day, no significant associations have been seen.
In one large pooled analysis, the diabetes risk per daily serving of sugary drinks was 18%. That is similar to or lower than other dietary risks. Processed meat carries a 51% higher risk per 100 g a day, fried food 55% and a high glycaemic index diet 33%. Body mass index, by comparison, raises diabetes risk 10 to 30 times between its lowest and highest levels. That is similar to the link between long-term smoking and lung cancer. Therefore, comparing sugary drinks with cigarettes does not hold up.
Possible mechanisms remain partly theoretical. When the liver makes fat from sugar, intermediate products such as diacylglycerols may disrupt insulin signalling. The result may be insulin resistance (when cells respond less readily to insulin). Insulin resistance may in turn encourage fat to build up in the liver and muscle. Feeding fructose directly to people has had only a mild effect on insulin sensitivity in healthy people. Harmful effects have been reported in people with obesity or diabetes, however.
In the 42-day rat study, both sugars increased insulin resistance. Researchers measured this with HOMA-IR, a score calculated from fasting glucose and insulin. Both also lowered BDNF (brain-derived neurotrophic factor, a protein that supports nerve health), and white sugar lowered it significantly more. In people, blood BDNF is reduced in insulin resistance and diabetes. The researchers concluded that high intakes of either sugar are not recommended.
Blood Fats
Randomised controlled trials have compared sugars with starch at equal calories. Sugars raised triglycerides (the main type of fat circulating in the blood) and total cholesterol. They raised LDL cholesterol (often called ‘bad’ cholesterol) too. Yet they also raised HDL cholesterol (often called ‘good’ cholesterol), a beneficial change, and had no effect on blood pressure. Those trials had limits. Their definition of sugars included glucose and maltose, which contain no fructose. Almost 40% of the freely eating studies also did not strictly control energy intake.
Fructose raises triglycerides only above certain intakes. When it replaced other carbohydrates at equal calories, fasting triglycerides rose only above 60 g a day in people with type 2 diabetes. In people with mixed metabolic profiles, the threshold was 100 g a day. Later updated meta-analyses did not reproduce even those rises. However, when added as excess calories, fructose raised triglycerides both fasting and after meals.
The measurements themselves are disputed. One meta-analysis that found no rise in after-meal triglycerides was funded by companies that produce sugar-sweetened beverages, so researchers treat its findings with caution. In studies with 24-hour blood sampling, fructose did not raise triglycerides compared with glucose or starch until after lunch. The largest differences appeared four to five hours after dinner, so short testing windows can miss the rise.
Sugar type showed up in direct trials. People who drank fructose-sweetened beverages for ten weeks increased liver fat production and developed unhealthier blood lipids. People drinking glucose-sweetened beverages did not, despite similar weight gain. A double-blind randomised trial in 94 healthy men tested drinks sweetened with fructose, sucrose or glucose. Fructose and sucrose drinks increased liver fat production, while glucose drinks did not. Such drinks may also shift LDL particles towards smaller, more atherogenic forms (those more likely to contribute to clogged arteries).
Dose shaped the response as well. Young adults added drinks supplying 0%, 10%, 17.5% or 25% of their daily energy as high-fructose corn syrup for two weeks. Their lipid risk factors for cardiovascular disease and uric acid rose in step with the dose. Body weight rose by 0.8 kg in the highest-dose group.
In the six-month rat study, brown and white sugar parted company on blood fats. Brown sugar raised triglycerides at two months, after which they returned to control levels. Refined sugar, by contrast, caused a sustained rise at four and six months. Brown sugar also lowered total cholesterol below control levels at four and six months, while refined sugar left it unchanged. LDL and HDL cholesterol did not differ between the groups.
Fatty Liver Disease
Non-alcoholic fatty liver disease (fat building up in the liver, unrelated to alcohol) is the leading form of chronic liver disease worldwide. The largest set of controlled trials, 51 trials in 2,059 mostly healthy younger adults, separated calories from food source. Adding fructose-containing sugars as extra calories caused a large increase in fat stored inside liver cells. The rise was about 10% from baseline, equivalent to roughly 0.7% liver fat.
That effect came entirely from sugar-sweetened beverages, which supplied 27 to 30% excess energy, and the evidence was highly certain. The same drinks raised alanine aminotransferase (ALT, a liver enzyme that rises when the liver is under strain) by about 11%. Swapped for other carbohydrates at equal calories, the same sugars had no effect on liver fat or liver enzymes. Fruit, 100% fruit juice, dried fruit, sweets, desserts, and honey also showed no significant effect. Most of that evidence, though, came from a few small trials.
Large intakes leave a clear mark. In a six-month trial, adults drank 1 litre of sugar-sweetened beverages a day, providing 106 g of added sugars. They gained liver fat and visceral fat (fat stored around the organs). Their total cholesterol and triglycerides also rose, while the same calories from milk produced none of these changes. In observational studies, drinking sugar-sweetened beverages has been linked with a 39% higher risk of the disease. Among older Finnish adults, whose fructose came mainly from fruit, higher fructose intake was linked with a lower risk.
People with the disease make new fat in the liver at three times the rate of healthy people. Breaking down fructose can also raise uric acid inside liver cells, which may slow fat burning there. However, the causal role is unclear because animals bred to have high uric acid do not develop fatty liver disease.
Of the two direct comparisons in rats, only the six-month study measured liver fat. Refined sugar raised it significantly by four and six months. At six months, liver triglycerides in those rats were double those of control rats and almost three times those of rats given brown sugar. Brown sugar did not increase liver fat. Neither sugar damaged liver tissue, judged by the liver enzymes ALT and AST, and both increased the liver’s fat-making enzyme. The researchers could not identify the mechanism behind the difference. They also cautioned that six months of feeding in rats cannot be extrapolated to humans.
Heart Disease, Stroke and Blood Pressure
Each extra 250 mL a day of sugar-sweetened beverages has been linked with a 17% higher risk of coronary heart disease. The same amount carried a 7% higher risk of stroke, with no link to heart failure. Each extra daily serving has also been linked with an 8% higher risk of cardiovascular disease. The risk of dying from it rose by a similar 8%, although that link did not appear among participants from Asia.
Sugar type changes the signal. Comparing the highest intakes with the lowest, fructose and total sugars were linked with an 8 to 9% higher risk of death from cardiovascular disease. By contrast, sucrose was linked to a lower risk. Added sugars showed no link with cardiovascular death. Neither sucrose nor total sugars was linked with developing cardiovascular disease in the first place.
Blood pressure follows the drinks. Across 13 prospective cohorts of adults, each extra 355 mL serving of sugar-sweetened beverages per day raised the risk of developing high blood pressure by 11%. By contrast, total fructose intake was not linked to high blood pressure. In children and adolescents, the highest intakes of sugary drinks went with a 36% higher risk of high blood pressure. Their systolic blood pressure (the upper number in a reading) was 1.67 mm Hg higher.
One proposed route runs through uric acid. High levels may alter the kidney’s small blood vessels and make the body retain sodium. They may also reduce nitric oxide (a molecule that relaxes blood vessels) and activate a hormone system that raises blood pressure. Together, these effects may help explain the link between fructose-containing sugars and cardiovascular disease, although they remain proposals.
Few long-term human studies have examined brown sugar itself. One followed 5,004 adults aged 35 to 69 on Japan’s Amami Islands for a median of 13.4 years. People there habitually eat brown sugar as a snack. Researchers grouped people by how often they ate brown sugar: less than once a week, one to six times a week, or daily. The analysis adjusted for age, sex, smoking, drinking, physical activity, body mass index, blood pressure, blood lipids and glucose intolerance. It also adjusted for other sweets, soft drinks and overall diet.
After those adjustments, eating brown sugar more often was not linked with a higher or lower risk of death. That held for death from any cause, from cancer and from cardiovascular disease. At the start of the study, brown sugar intake was also not linked to high blood pressure, abnormal blood lipids, or glucose intolerance. The study measured how often people ate brown sugar, and it did not compare brown and white sugar head to head. Its result sits apart from studies elsewhere that link added sugar intake with cardiovascular disease.
Why Brown Sugar Can Seem Healthier
The Sugar Association, the US sugar industry’s trade body, states that raw sugar is no healthier than table sugar. According to the association, raw, brown and white sugars are all processed the same way in the body. Their darker colours come from small amounts of molasses left on the crystals.
It says the nutrients in that amount offer no real nutritional value. An agribusiness handbook from the Food and Agriculture Organization takes the opposite line. Without citing evidence, it states that refining reduces sugar’s nutritive value and alters its natural taste.
The idea that brown sugar is gentler has a long paper trail. In 1983, a book by Brekhman and Nesterenko reported on brown sugar in rats. It described fewer harmful effects on reproduction and lifespan than refined sugar. The authors argued that refined sugar should carry warnings like ‘this product can damage your health,’ similar to cigarettes or alcohol. Decades later, a survey in Japan’s Kagoshima Prefecture looked at the diets of healthy residents over 90. It listed locally produced brown sugar among the ‘longevity foods’ they ate more often. Japan has the second-highest average life expectancy in the world, after Hong Kong.
Researchers who study food choices define perceived healthiness as a shopper’s expectation of how a product will affect their health. The healthier a product seems, the more likely people are to buy it. Credible health benefits also raise their willingness to pay more. No precise, agreed definition of a ‘healthy food’ exists. Dietitians argue that only whole diets are appropriate or inappropriate. Yet consumers still sort single foods as healthy or unhealthy.
A review of 59 consumer studies published between 2014 and 2019 found that no single factor decides those judgements. Instead, it grouped the influences into six categories. These included information on the pack, the product category, packaging shape and colour, ingredients, organic origin, and taste. Several of those influences are well documented.
- Packaging Colour: Shoppers spend about 2.5 seconds choosing a product from a shelf, so first impressions and visual cues matter. In most studies, cool colours such as blue and green made packs seem healthier than warm colours such as red and yellow. However, the effect depends on the food. Red signalled health on frozen pizza, apparently by suggesting vegetables, but on yoghurt, it suggested artificial colouring. Paler packs tend to look healthier and less tasty. No single colour is likely to signal health across all foods, people and countries.
- ‘Natural’ Claims: In a 2019 experiment, 1,078 US parents viewed an identical fruit drink with or without a ‘natural’ claim. It contained about 37 g of sugar (roughly 9 teaspoons) and only 20% fruit juice. Labelling it ‘natural’ or ‘100% all natural’ raised parents’ intention to buy it for their child. Fewer of them believed the drink contained added sugar: 72 to 76%, against 83% with no claim. They also estimated about 2 fewer teaspoons. In the United States, the term is not strongly regulated, so it can appear on unhealthy products.
- Organic Origin: Across several studies, organic origin consistently made consumers judge a food as healthier. Researchers describe this as a ‘health halo’ around organic products.
- Price: Consumers tend to expect more expensive foods to be healthier. Packaging that signals a premium range could therefore shape health expectations as well as quality expectations. However, that link has received little research attention.
- Taste: Perceived healthiness also shapes how tasty people expect a food to be. Many consumers assume that unhealthy food is tasty. When the two collide, taste tends to win.
Belief can reach the body itself. Ghrelin, the hunger hormone, fell after a 380-calorie milkshake labelled ‘indulgent, 620 calories’. After the identical milkshake labelled ‘sensible, 140 calories’, ghrelin levels did not fall. Similarly, brain areas linked with reward were more active when people drank a milkshake labelled ‘regular’ than an identical one labelled ‘low-fat’.
None of this research tested brown sugar directly. Applied to brown and white sugar, it offers plausible explanations rather than documented ones. A darker colour, a ‘raw’ or ‘unrefined’ description, and a higher price all align with cues that make other foods seem healthier. Researchers have not measured whether they drive sugar choices in the same way.
Commercial and scientific messages add to the image. In Malaysia, minimally refined brown sugar was brought to market on the strength of its antioxidant content. It was described as a cane brown sugar with a low glycaemic index. Researchers suggested that swapping refined sugar for it could provide an extra source of antioxidants. However, the health effects of making that swap had not been assessed. Food science research also describes noncentrifugal sugar as a functional ingredient. Some researchers suggest it might help manage chronic diseases linked with obesity, diabetes and inflammation.
Much of that promise rests on laboratory and animal work. In test-tube assays, extracts of less refined and brown sugar inhibited α-glucosidase (an enzyme that releases glucose from sugars in the gut). The effects were about 25% and 21%, respectively, while refined sugar had no effect.
Whether those extracts prevent rises in blood glucose after eating has not been determined. A systematic review of unrefined sugar and inflammation searched the literature up to December 2021. It found five relevant studies: two in human blood cultures and three in animals. None was a human intervention study.
Laboratory results need careful reading for another reason. Cell studies often use polyphenol concentrations far higher than the levels that reach the blood after normal eating. That can produce artificially positive results. Animal studies bridge some of that gap, yet genetic differences between animals and humans make their findings hard to apply to people.
Industry messaging about sugar in general has centred on calories. Sugar-related industries have campaigned to persuade the public that excess calories alone drive obesity and metabolic disease. Industry statements have included claims that experts continue to conclude sugar intake is not a cause of any disease, including obesity.
Nutritional guidance draws no line between brown and white sugar. The UK’s free sugars limit counts both alike, because both are sugars added to food. Claims about flavour, quality and baking performance are a separate matter from claims about health. Some bakeries prefer dark brown cane sugar, molasses or other alternative sweeteners for special breads and biscuits.
These give a distinctive appearance and flavour. A healthy image, though, does not guarantee a better result. Maple syrup is widely considered a healthier alternative. Yet whole-grain wheat cookies made with it and baked for 13 minutes contained high levels of acrylamide. Acrylamide is a compound formed during high-temperature cooking and classed as probably carcinogenic to humans.
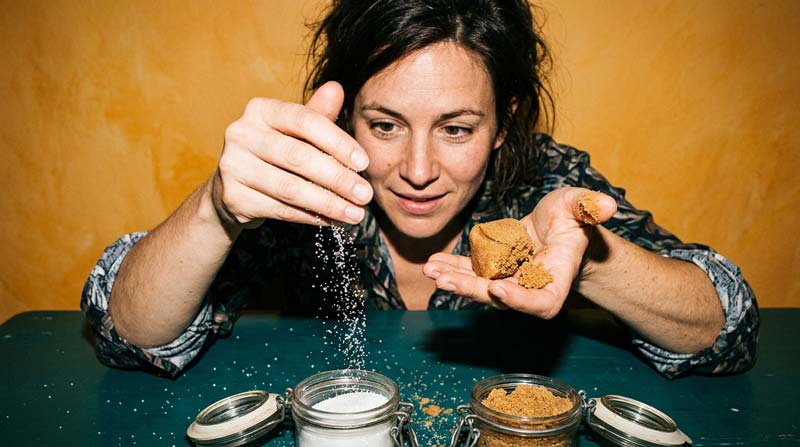
What Matters When Choosing Between Brown and White Sugar
You can replace white sugar with an equal amount of brown sugar in most recipes. The main difference is a slight molasses flavour. People often use light brown sugar in sauces and most baked goods. Dark brown sugar, with its richer, fuller flavour, suits gingerbread, baked beans, and barbecue dishes. The extra moisture in brown sugars also helps baked goods stay moist and chewy. White sugar, meanwhile, stays neutral in flavour and dry in texture.
That moisture has a cost in the cupboard. Brown sugar hardens as its moisture evaporates, so store it in its original bag, tightly closed, or in an airtight container. Hardened brown sugar softens overnight in a sealed jar with a damp paper towel or a slice of apple. White sugar hardens when damp air reaches it and the surface then dries. Sugar itself does not spoil.
Crystal size decides other jobs. Coarse sugars add sparkle and flavour when sprinkled on baked goods. Caster sugar is common in baking, while superfine sugar suits drinks and meringues. Confectioners’ sugar and granulated sugar are usually not interchangeable. The former has much finer particles and a little cornstarch to prevent caking.
The richer unrefined sugars behave differently again. When noncentrifugal sugar replaced white sugar in strawberry and kiwifruit jams, colour was the only physical property that changed significantly. Antioxidant capacity also rose. In low-sugar pectin jellies, however, noncentrifugal sugar alone gave a softer, weaker gel and turned the jelly yellowish-brown. Replacing a quarter of the white sugar produced the firmest gel, matching an all-white-sugar version. The minerals and phenolic compounds credited with its health benefits appear to weaken the gel. They compete with the pectin and calcium that hold it together.
In the oven, the type of sugar also shapes what forms. Whole-grain wheat cookies baked at 180 °C with sucrose contained far less acrylamide than cookies made with fructose or glucose. After 7 minutes, they held about 8.9 and 9.8 times less. By 13 minutes, the gap had narrowed to 1.7 and 1.5 times. At that point, cookies made with brown cane sugar held 592.1 µg/kg (micrograms per kilogram).
Those made with coconut sugar or pumpkin jam held over 2,000 µg/kg. Cookies made with brown cane sugar and white sucrose had the lowest acrylamide of all. They also had the lowest HMF (hydroxymethylfurfural, a compound formed when sugars are heated). The brown cane sugar in that study was a near-white commercial product. The researchers could not pin the effects on any single component.
Labels can identify a sugar, within limits. On a shop shelf, ‘raw cane sugar’ usually means turbinado. In contrast, ‘unrefined’ can mean anything from muscovado to whole cane sugar. Nutrition panels, meanwhile, show brown and white sugar as almost identical per 100 g. Colour-coded front-of-pack labels have helped shoppers in six countries more often pick the healthiest of three breakfast cereals. The six were Australia, China, India, New Zealand, the United Kingdom and the United States. In Canada, black-and-white labels worked better.
A price premium for brown sugar buys things you can taste and measure in the kitchen: molasses flavour, colour, moisture, and chewiness. It also buys minerals and antioxidants that are real but small at the teaspoon scale. How much those qualities are worth is a judgement each buyer makes.
Portion and frequency carry most of the weight in the guidance. The World Health Organization recommends keeping free sugars below 10% of daily energy. On a typical 2,000 kcal diet, that means less than 50 g, or 12 teaspoons. That advice rests on observational data on dental caries (tooth decay).
The UK’s Scientific Advisory Committee on Nutrition goes further, recommending less than 5%. It found that high sugar intake went with high energy intake. A 2023 umbrella review of 73 meta-analyses suggested less than 25 g of free or added sugars a day, roughly six teaspoons. It also suggested fewer than one sugary drink a week.
For scale, one 240 mL serving of a sugar-sweetened drink contains about 26 g of sucrose, roughly 5% of an adult’s daily energy. A single glass can therefore use up the UK’s recommended share. The guidelines themselves focus on cutting calories from added sugars, especially drinks, rather than on any special effect of fructose. None of them restricts fruit or vegetables.
Lower-sugar products are not always lower in energy. Sugar sweetens, but it also adds bulk, holds moisture, preserves, helps fermentation and browns in the oven. Replacing it usually takes several ingredients. Most bulking agents are themselves carbohydrates that supply energy, so ‘low-sugar’ products may save few or no calories.
The usefulness of the glycaemic index is still debated. The World Health Organization and several diabetes organisations, including Diabetes UK, give it qualified support. Yet many health professionals regard it as too complex and variable for clinical use. Many confectionery items, such as chocolate, have a low glycaemic index but a high saturated fat content. Many foods have also been tested only once in 10 or fewer people, and the same product can differ between brands and countries. A low-GI label on a sugar describes one property of one product.
The whole diet frames the decision. Limiting added sugars is a prudent way to curb excess calories, given how easily people overeat sugary foods and drinks. Even so, sugar content should not be the only measure of a healthy diet. Some foods supply excess calories, while others supply beneficial nutrients alongside their sugar. For example, fruit, yoghurt, and whole-grain cereals may improve blood glucose control when eaten instead of refined starches, especially for people with diabetes. Improving overall dietary patterns appears to have the greatest influence on weight gain and cardiometabolic risk.
In that context, brown and white sugar are the same sucrose, with different amounts of molasses. Brown sugar brings flavour, colour, moisture and traces of minerals and plant compounds. White sugar brings neutrality, dryness and consistency. Both count against the same daily limit. In the human evidence, the amount eaten and the calories it adds outweigh the colour.
One question sits outside this comparison: whether the body needs added sugar at all, and how much is too much. That is a separate discussion, and the evidence on brown and white sugar neither answers it nor depends on it. Which qualities earn a place in a kitchen, and how often, is a decision the person holding the spoon makes.
Sources
- Ali SE, El Gedaily RA, Mocan A, Farag MA, El-Seedi HR. Profiling Metabolites and Biological Activities of Sugarcane (Saccharum officinarum Linn.) Juice and its Product Molasses via a Multiplex Metabolomics Approach. Molecules. 2019 Mar 7;24(5):934.
- Azlan A, Ebadi S, Yusof BNM, Othman NMH, Kannar D, Sultana S, et al. Satiety, glycemic profiles, total antioxidant capacity, and postprandial glycemic responses to different sugars in healthy Malaysian adults. Nutrition. 2022;97:111551.
- Azlan A, Khoo HE, Sajak AAB, Aizan Abdul Kadir NA, Yusof BNM, Mahmood Z, Sultana S. Antioxidant activity, nutritional and physicochemical characteristics, and toxicity of minimally refined brown sugar and other sugars. Food Sci Nutr. 2020 Jul 31;8(9):5048-5062.
- Azlan A, Sultana S, Mahmod II. Effect of Different Extraction Methods on the Total Phenolics of Sugar Cane Products. Molecules. 2023 May 28;28(11):4403.
- Barrera N., Betoret L., Seguí L. Phenolic Profile of Cane Sugar Derivatives Exhibiting Antioxidant and Antibacterial Properties. Sugar Technol. 2020;22:798–811.
- Bechthold A, Boeing H, Schwedhelm C, et al. Food groups and risk of coronary heart disease, stroke and heart failure: A systematic review and dose-response meta-analysis of prospective studies. Crit Rev Food Sci Nutr 2019;59:1071-90.
- Braunstein CR, Noronha JC, Glenn AJ, et al. A double-blind, randomized controlled, acute feeding equivalence trial of small, catalytic doses of fructose and allulose on postprandial blood glucose metabolism in healthy participants: the Fructose and Allulose Catalytic Effects (FACE) Trial. Nutrients 2018;10:E750.
- Bray GA, Nielsen SJ, Popkin BM. Consumption of high-fructose corn syrup in beverages may play a role in the epidemic of obesity. Am J Clin Nutr. 2004;79(4):537–543.
- Brekhman II, Nesterenko IF (1983). Brown Sugar and Health. Pergamon Press. Oxford. ISBN 0-08-026837-4.
- Choo VL, Viguiliouk E, Blanco Mejia S, Cozma AI, Khan TA, Ha V, Wolever TMS, Leiter LA, Vuksan V, Kendall CWC, de Souza RJ, Jenkins DJA, Sievenpiper JL. Food sources of fructose-containing sugars and glycaemic control: systematic review and meta-analysis of controlled intervention studies. BMJ. 2018 Nov 21;363:k4644. Erratum in: BMJ. 2019 Oct 9;367:l5524.
- Ebadi S, Azlan A. Nutritional composition and role of non-centrifugal sugar (NCS) in human health. Curr Nutr Food Sci. 2021;17:249–57.
- Ebadi S, Azlan A. The Effect of Unrefined Sugar on Inflammation: A Systematic Review of Intervention Studies. Int J Prev Med. 2023 Oct 30;14:121.
- Fakhar HI, Cavdaroglu E, Hayat MQ, Janjua HA, Oztop MH. Exploring Noncentrifugal Sugar as a Partial Replacement for White Sugar in Low Methoxyl Pectin Confectionery Gels: Impacts on Physical and Rheological Properties. ACS Food Sci Technol. 2024 Dec 10;4(12):3036-3046.
- Food and Agriculture Organization of the United Nations (FAO). Agribusiness Handbook: Sugar Beet / White Sugar. Prepared by Inna Punda; reviewed by Dmitry Prikhodko. Rome: FAO Investment Centre Division; 2009.
- Geidl-Flueck B, Hochuli M, Németh Á, et al. Fructose- and sucrose- but not glucose-sweetened beverages promote hepatic de novo lipogenesis: A randomized controlled trial. J Hepatol 2021;75:46-54.
- Gómez-Crisóstomo NP, de la Cruz AD, Camacho LJU, de la Cruz-Hernández EN, Martínez-Abundis E. Chronic consumption of refined but not brown sugar induces Hypertriglyceridemia and fat accumulation in rat liver. Acad J Sci Res. 2017;5(10):451–9.
- Guerra, M. J., & Mujica, M. V. (2010). Physical and chemical properties of granulated cane sugar “panelas”. Food Science and Technology, 30(1), 250–257.
- Guideline: sugars intake for adults and children. WHO Guidelines approved by the Guidelines Review Committee. Geneva, 2015.
- Hall MG, Richter APC, Ruggles PR, Lee CJY, Lazard AJ, Grummon AH, Higgins ICA, Duffy EW, Taillie LS. Natural Claims on Sugary Fruit Drinks: A Randomized Experiment With U.S. Parents. Am J Prev Med. 2023 Nov;65(5):876-885.
- Huang Y, Chen Z, Chen B, Li J, Yuan X, Li J, Wang W, Dai T, Chen H, Wang Y, Wang R, Wang P, Guo J, Dong Q, Liu C, Wei Q, Cao D, Liu L. Dietary sugar consumption and health: umbrella review. BMJ. 2023 Apr 5;381:e071609.
- Institute of Food Technologists (IFT). Processing: How Sugar Is Processed. Food Technology Magazine. 1 July 2020.
- Jung S, Bae H, Song WS, Jang C. Dietary Fructose and Fructose-Induced Pathologies. Annu Rev Nutr. 2022 Aug 22;42:45-66.
- Kearns CE, Schmidt LA, Glantz SA (2016) Sugar industry and coronary heart disease research: a historical analysis of internal industry documents. JAMA Intern Med 176(11):1680–1685.
- Khan TA, Sievenpiper JL. Controversies about sugars: results from systematic reviews and meta-analyses on obesity, cardiometabolic disease and diabetes. Eur J Nutr. 2016 Nov;55(Suppl 2):25-43.
- Khan TA, Tayyiba M, Agarwal A, et al. Relation of Total Sugars, Sucrose, Fructose, and Added Sugars With the Risk of Cardiovascular Disease: A Systematic Review and Dose-Response Meta-analysis of Prospective Cohort Studies. Mayo Clin Proc 2019;94:2399-414.
- Lee D, Chiavaroli L, Ayoub-Charette S, Khan TA, Zurbau A, Au-Yeung F, Cheung A, Liu Q, Qi X, Ahmed A, Choo VL, Blanco Mejia S, Malik VS, El-Sohemy A, de Souza RJ, Wolever TMS, Leiter LA, Kendall CWC, Jenkins DJA, Sievenpiper JL. Important Food Sources of Fructose-Containing Sugars and Non-Alcoholic Fatty Liver Disease: A Systematic Review and Meta-Analysis of Controlled Trials. Nutrients. 2022 Jul 12;14(14):2846.
- Lee, J. S., Ramalingam, S., Jo, I. G., Kwon, Y. S., Bahuguna, A., Oh, Y. S., … Kim, M. (2018). Comparative study of the physicochemical, nutritional, and antioxidant properties of some commercial refined and non‐centrifugal sugars. Food Research International, 109, 614–625.
- Liu Q, Ayoub-Charette S, Khan TA, et al. Important Food Sources of Fructose-Containing Sugars and Incident Hypertension: A Systematic Review and Dose-Response Meta-Analysis of Prospective Cohort Studies. J Am Heart Assoc 2019;8:e010977.
- Lustig RH, Schmidt LA, Brindis CD. Public health: the toxic truth about sugar. Nature. 2012;482(7383):27–29.
- McDevitt R.M., Bott S.J., Harding M., Coward W.A., Bluck L.J., Prentice A.M. De novo lipogenesis during controlled overfeeding with sucrose or glucose in lean and obese women. Am. J. Clin. Nutr. 2001;74:737–746.
- Meng Y, Li S, Khan J, et al. Sugar- and Artificially Sweetened Beverages Consumption Linked to Type 2 Diabetes, Cardiovascular Diseases, and All-Cause Mortality: A Systematic Review and Dose-Response Meta-Analysis of Prospective Cohort Studies. Nutrients 2021;13:2636.
- Miyamoto K, Yasuda T, Akaho T, Ibusuki R, Shimoshikiryo I, Nishimoto D, Miyahara H, Tokushige K, Tanoue S, Koriyama C, Takezaki T. Association between brown sugar intake and decreased risk of cancer in the Amami islands region, Japan. Asia Pac J Clin Nutr. 2023 Dec;32(4):426-433.
- Pettigrew S., Dana L.M., Talati Z., Tian M., Praveen D. The Role of Colour and Summary Indicators in Influencing Front-of-Pack Food Label Effectiveness across Seven Countries. Public Health Nutr. 2021;24:3566–3570.
- Plasek B, Lakner Z, Temesi Á. Factors that Influence the Perceived Healthiness of Food-Review. Nutrients. 2020 Jun 24;12(6):1881.
- Public Health England. Government Dietary Recommendations: Government recommendations for energy and nutrients for males and females aged 1–18 years and 19+ years. London: Public Health England; 2016.
- Qin P, Li Q, Zhao Y, et al. Sugar and artificially sweetened beverages and risk of obesity, type 2 diabetes mellitus, hypertension, and all-cause mortality: a dose-response meta-analysis of prospective cohort studies. Eur J Epidemiol 2020;35:655-71.
- Rippe JM. Fructose, high fructose corn syrup, sucrose and health. Berlin: Springer; 2014.
- Rumessen JJ, Gudmand-Hoyer E. Absorption capacity of fructose in healthy adults. Comparison with sucrose and its constituent monosaccharides. Gut. 1986;27(10):1161–8.
- Seguí, L., Calabuig‐Jiménez, L., Betoret, N., & Fito, P. (2015). Physicochemical and antioxidant properties of non‐refined sugarcane alternatives to white sugar. International Journal of Food Science and Technology, 50, 2579–2588.
- Shamsi-Goushki A, Mortazavi Z, Mirshekar MA, Behrasi F, Moradi-Kor N, Taghvaeefar R. Effects of High White and Brown Sugar Consumption on Serum Level of Brain-Derived Neurotrophic Factor, Insulin Resistance, and Body Weight in Albino Rats. J Obes Metab Syndr. 2020 Dec 30;29(4):320-324.
- Stanhope KL, Medici V, Bremer AA, Lee V, Lam HD, Nunez MV, et al. A dose-response study of consuming high-fructose corn syrup-sweetened beverages on lipid/lipoprotein risk factors for cardiovascular disease in young adults. Am J Clin Nutr. 2015;101(6):1144–54.
- Steiner K, Florack A. The Influence of Packaging Color on Consumer Perceptions of Healthfulness: A Systematic Review and Theoretical Framework. Foods. 2023 Oct 25;12(21):3911.
- Sugar Association, Inc. How Well Do You Know Sugar? Third Edition. Washington, DC: Sugar Association, Inc.; 2024.
- Te Morenga LA, Howatson AJ, Jones RM, Mann J. Dietary sugars and cardiometabolic risk: systematic review and meta-analyses of randomized controlled trials of the effects on blood pressure and lipids. Am J Clin Nutr. 2014;100(1):65–79.
- Te Morenga L, Mallard S, Mann J. Dietary sugars and body weight: systematic review and meta-analyses of randomised controlled trials and cohort studies. BMJ. 2013;346:e7492.
- Tsilas CS, de Souza RJ, Mejia SB, et al. Relation of total sugars, fructose and sucrose with incident type 2 diabetes: a systematic review and meta-analysis of prospective cohort studies. CMAJ 2017;189:E711-20.
- Uma P, Hariharan RS, Ramani V, Seshiah V. Glycaemic indices of different sugars. Int J Diabetes Dev Ctries. 1987 Jan–Apr:78-82.
- U.S. Department of Agriculture, Agricultural Research Service. FoodData Central, SR Legacy. Sugars, brown (FDC ID: 168833); Sugars, granulated (FDC ID: 169655).
- van Buul VJ, Tappy L, Brouns FJPH. Misconceptions about fructose-containing sugars and their role in the obesity epidemic. Nutr Res Rev. 2014;27(1):119–130.
- Watts G. Sugar and the heart: old ideas revisited. BMJ. 2013;346:e7800.
- Yeboah J, Santoro AM, Arrieta-Escobar JA, Caballero IM, Orjuela A, Novoa CF, et al. Heuristic-based computer-aided design of ice creams and validation by using jaggery as refined sugar substitute. Chem Eng Res Des. 2022;184:256–66.
- Yudkin J (1972) Pure, white and deadly: the problem of sugar. Davis-Poynter Limited
- Zidan D.; Azlan A. Non-Centrifugal Sugar (NCS) and Health: A Review on Functional Components and Health Benefits. Appl. Sci. 2022, 12 (1), 460.
- Žilić S, Sarić B, Milovanović D, Hamzalıoğlu A, Nikolić V, Simić M, Gökmen V. Effect of alternative sweeteners on acrylamide, HMF and color formation in whole-grain wheat cookies. Food Chem X. 2026 Jan 28;34:103600.