
By BeSund Editorial Team 11/07/2023 Modified Date: 20/01/2026
Waist-to-Hip Ratio
Calculate this ratio to identify potential health risks
Waist-to-Hip Ratio (WHR) Evaluation

Understanding Waist-to-Hip Ratio
Waist-to-hip ratio (WHR) emerged from a 1984 Swedish study that tracked men born in 1913 over 13 years. Researchers discovered something unexpected: body weight failed to predict who would die from heart disease. The pattern emerged only when comparing waist measurements against hip measurements.
Men with high ratios faced increased risk of myocardial infarction (heart attack), stroke, and premature death. Body mass index (BMI) showed no predictive power. A parallel study in Swedish women confirmed the finding. WHR appeared as a stronger independent risk factor than BMI for cardiovascular disease.
The WHR is waist circumference divided by hip circumference, yielding a dimensionless number. This calculation captures patterns of body fat distribution. Higher values indicate android obesity (apple-shaped, with fat concentrated in the trunk). Lower values suggest gynoid obesity (pear-shaped, with fat distributed in the hips and thighs).
The hip circumference measurement arrived first in the 1950s. Public health researchers used it to assess body shape and reproductive health in women. Standing alone, hip circumference proved clinically useless. It couldn’t predict metabolic risk factors (processes that affect energy use and storage in the body). The measurement lost clinical value over time because it doesn’t strongly predict disease risk on its own.
The progression unfolded in three phases. From the 1950s to the 1980s, hip circumference was measured mainly as part of body shape assessment. The 1980s onwards saw WHR become the gold standard, as research showed that central adiposity (abdominal fat accumulation) was the key predictor of metabolic risk. The 2000s brought a shift. Waist circumference alone gained traction because it’s simpler and nearly as predictive for cardiovascular risk.
The waist-to-hip ratio was specifically developed to identify obesity subgroups with higher cardiovascular disease risk. Early researchers noticed that specific obese individuals demonstrated worse metabolic profiles than others at equivalent body weight. The difference lay in the distribution of fat.
The ratio differs fundamentally from BMI and waist circumference alone. BMI treats all weight equally, unable to distinguish muscle from fat. Waist circumference captures abdominal accumulation but ignores hip measurement. WHR accounts for both measurements simultaneously, recognising their independent and opposite effects.
Android patterns increase the risk of hypertension (elevated blood pressure), metabolic syndrome (a cluster of conditions including high blood pressure and abnormal cholesterol), type 2 diabetes, dyslipidaemia (abnormal blood fats), and coronary artery disease. Gynoid patterns demonstrate more favourable metabolic profiles.
Waist reflects abdominal fat accumulation. Hip indicates gluteal muscle mass and peripheral fat storage. Both matter, operating in opposing directions. A higher waist increases risk. Higher hip decreases risk. The ratio captures this dual dynamic.
Why Body Fat Distribution Determines Risk
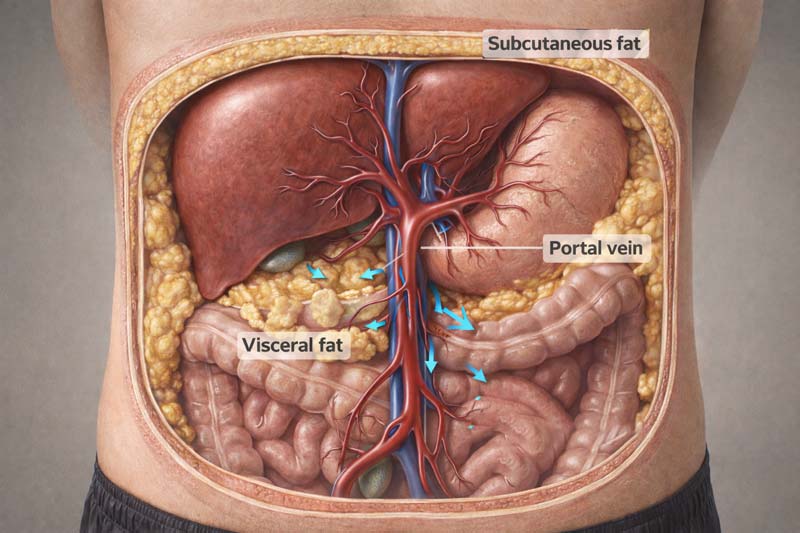
Visceral adipose tissue (fat within and surrounding internal organs) behaves differently from subcutaneous fat (fat beneath skin). Location determines metabolic consequences.
Visceral fat sits deep in the abdomen, surrounding the liver, pancreas, intestines, and kidneys. Subcutaneous fat sits in distinct layers beneath the skin, storing energy relatively inertly.
Intra-abdominal adipocytes (fat cells) possess a unique anatomical feature. They empty free fatty acids directly into the portal vein, which carries blood from the intestines to the liver. The liver is constantly exposed to high concentrations of fatty acids. Subcutaneous fat drains into systemic circulation, bypassing this direct liver exposure.
Experimentally induced high portal free fatty acid concentrations inhibit hepatic (liver) insulin uptake. Peripheral hyperinsulinaemia (excess insulin in the bloodstream) develops. Insulin insensitivity follows, creating a tendency to develop diabetes mellitus.
The metabolic cascade unfolds in a predictable sequence. Insulin resistance develops first. Muscle and liver cells respond poorly to insulin signals. The pancreas compensates by increasing insulin production to maintain normal blood sugar levels. This hyperinsulinaemia itself damages blood vessels.
Dyslipidaemia (abnormal blood fats) develops next. Triglycerides (fat molecules in blood) rise. HDL cholesterol (high-density lipoprotein, good cholesterol) falls. Small, dense LDL particles (low-density lipoprotein, bad cholesterol) increase, penetrate arterial walls easily, and accelerate atherosclerosis (plaque buildup in arteries). Blood pressure elevation follows. Visceral fat produces angiotensinogen (a protein that raises blood pressure). Insulin resistance independently increases sodium retention in the kidneys.
Cardiovascular Disease (CVD) Risk Evidence:
- Research tracking 27,098 participants across 52 countries precisely established the relationship. Abdominal obesity measured by the waist-to-hip ratio accounted for more heart attack risk than any modifiable factor except smoking.
- The effect exceeded that of high blood pressure or elevated cholesterol. BMI and WHR are both strongly associated with myocardial infarction.
- Relationships with BMI weakened after adjustment for WHR. Relationships with waist measures remained relatively unaffected by BMI adjustment.
- The positive association between obesity and type 2 diabetes risk has been repeatedly observed. Cross-sectional studies provide convincing evidence that the waist-to-hip ratio predicts diabetes association, with increased disease risk independent of other factors.
- WHR is associated with an increased risk of all-cause mortality across the range of adult BMI. The ratio is strongly predictive in young and middle-aged adults, but less so in older people and in those with low BMI.
Gluteofemoral adipose tissue (fat in hips and thighs) demonstrates unique metabolic properties. High lipoprotein lipase activity (an enzyme that breaks down fats) and low fatty acid turnover characterise this depot.
Favourable adipokine secretion (hormone-like proteins from fat cells) includes increased leptin and adiponectin alongside reduced inflammatory cytokines (signalling proteins promoting inflammation). Women naturally carry more subcutaneous fat. Men accumulate more visceral fat. These sex differences partially explain why men develop type 2 diabetes at a lower BMI than women.
Studies show individuals with hips narrower than expected for body mass face a 2 to 3-fold excess diabetes risk after adjusting for waist measurement. Possible mechanisms include reduced gluteal muscle mass affecting insulin clearance, a smaller skeletal frame, or metabolic factors influencing peripheral fat storage capacity.
Preparing for Your Measurement
Accurate waist-to-hip ratio assessment requires minimal equipment but demands careful attention to standardisation. Environmental factors and timing significantly influence readings.
Equipment Specifications
A flexible, non-stretch tape measure proves essential. The width should remain under 7mm for accurate placement of anatomical landmarks. Metal or fibreglass construction works best. Fabric tapes stretch with repeated use, introducing a systematic error of 2% or more.
Spring-loaded retractable tapes provide consistent tension at 750 grams. This tape design applies a constant amount of tension, eliminating variability between examiners. This standardisation improves measurement consistency.
Pre-Measurement Conditions
Standardise the time of day for performing circumference assessments. Refrain from eating and maintain adequate hydration for 4 to 6 hours before evaluation.
Recent food intake temporarily expands abdominal girth by 1 to 3cm, depending on meal size. A full bladder adds 1-2cm. Timing affects results significantly. Measure first thing in the morning after voiding (emptying bladder) but before breakfast.
Recent exercise temporarily increases abdominal blood flow. Wait at least 2 hours after moderate exercise, 4 hours after vigorous activity. Dehydration contracts tissue artificially.
Body Positioning and Environment
Stand with feet close together, arms at your sides, and body weight evenly distributed. Wear little clothing. Minimal, form-fitting garments allow accurate assessment. Remove bulky clothing entirely. Tight garments compress tissue artificially, underestimating by 2 to 4cm.
Remain relaxed throughout the measurement. Measurements should be taken at the end of normal expiration (breathing out). Some individuals unconsciously contract abdominal muscles during measurement. This protective response can reduce measurements by 2 to 3cm. Staying relaxed proves essential.
Room temperature between 20 and 24°C ensures comfort. Environmental factors influence readings.
The standardised measurement sites appear in the interactive reference below. Select your gender to view precise anatomical locations used for both waist and hip measurements.
📏 Waist-to-Hip Ratio Measurement Sites
Standardised anatomical landmarks for accurate waist-to-hip ratio evaluation
🔍
Ready to See the Measurement Sites?
Select a reference image to view the precise anatomical locations used for waist-to-hip ratio evaluation: identical for both men and women
Calculating Your Waist-to-Hip Ratio Step-by-Step
The calculation requires two measurements divided by each other. Precision in technique determines result validity.
- Waist measurement: Stand behind the person being measured. Palpate (feel with fingers) the iliac crest (large curving pelvic bone, just below the waist). Mark a horizontal line at the highest point on both sides of the skin. Palpate the lower rib margin. Mark the skin with a horizontal line at the lowest point on both sides. Identify the midpoint between the iliac crest and the lower rib margin. Mark this point on both the left and right sides. Apply tape at the midpoint marks. Ensure tape remains level around the waist. Tape should rest on the skin without indenting it. Relax, not deliberately holding in or out. Eyes look straight ahead with arms relaxed at sides. Measure at the end of expiration (breathing out). For complete guidance on measurement, see our dedicated page on waist circumference assessment.
- Hip measurement: Stand straight with legs together. Position tape around the widest part of the hip, located between the greater trochanter (top of the thigh bone) and the lower buttock level. Ensure tape remains horizontal around the hips. Tape rests on skin without indenting. Breathe out naturally. Take a measurement. For a detailed hip measurement protocol, visit our comprehensive hip circumference measurement guide.
- Division calculation: Divide waist circumference by hip circumference. Units cancel during division, producing a dimensionless ratio. The waist-to-hip ratio is expressed without units because the units cancel during division.
- Tape tension standardisation: Spring-loaded tape measures extend the handle to the same marking with each trial, applying standardised pressure of approximately 750 grams. With standard tapes, appropriate tension feels like gentle contact without compression.
- Duplicate measurements: Make three measurements of waist circumference. Make three measurements of hip circumference. Measure to the nearest 0.1cm. Record all measurements and calculate the mean by adding values together and dividing by three. If measurements differ by more than 0.6cm, take an additional measurement.
- Common measurement errors: Wrong anatomical site underestimates by 3 to 8cm. Tape not horizontal overestimates by 2 to 5cm. Excessive tape tension underestimates by 1 to 3cm. Measurement after eating overestimates by 1 to 2cm. Breath-holding creates a variable effect of ±2 cm.
The calculator below determines your waist-to-hip ratio and provides a personalised risk assessment based on age, gender, and ethnic background.
WAIST-TO-HIP RATIO CALCULATOR
Personal Details
Waist-to-hip ratio thresholds vary by age and gender. Enter your details for accurate results.
Enter number from 20 to 69
What Your Results Mean
The dimensionless ratio encodes biological information about fat distribution and peripheral tissue. Two individuals with identical WHR may demonstrate vastly different body composition profiles. A muscular individual with substantial gluteal development and someone with greater adipose tissue but less muscle mass could produce the same numerical reading.
The table below presents age-specific risk classifications for men and women. These thresholds establish how waist-to-hip ratio values correlate with health risk across different age groups.
Age Specific Risk Classification
| Age Group | Gender | Low Risk | Moderate Risk | High Risk | Very High Risk |
|---|---|---|---|---|---|
| 20-29 | Men | <0.83 | 0.83-0.88 | 0.89-0.94 | >0.94 |
| Women | <0.71 | 0.71-0.77 | 0.78-0.82 | >0.82 | |
| 30-39 | Men | <0.84 | 0.84-0.91 | 0.92-0.96 | >0.96 |
| Women | <0.72 | 0.72-0.78 | 0.79-0.84 | >0.84 | |
| 40-49 | Men | <0.88 | 0.88-0.95 | 0.96-1.00 | >1.00 |
| Women | <0.73 | 0.73-0.79 | 0.80-0.87 | >0.87 | |
| 50-59 | Men | <0.90 | 0.90-0.96 | 0.97-1.02 | >1.02 |
| Women | <0.74 | 0.74-0.81 | 0.82-0.88 | >0.88 | |
| 60-69 | Men | <0.91 | 0.91-0.98 | 0.99-1.03 | >1.03 |
| Women | <0.76 | 0.76-0.83 | 0.84-0.90 | >0.90 | |
Young adults are at very high risk when WHR values exceed 0.95 for men and 0.86 for women. These values rise to 1.03 and 0.90, respectively, for ages 60 to 69 years. Health risks increase as the waist-to-hip ratio rises.
The number reflects both abdominal fat accumulation AND peripheral tissue quantity. Someone with a 95cm waist and 95cm hip (ratio 1.00) faces a different risk than someone with a 105cm waist and 95cm hip (ratio 1.11) despite identical hip measurements. The first person has less abdominal fat but also less gluteal tissue protection.
Higher ratios indicate increased risk because they signal a predominance of abdominal fat. Android obesity patterns demonstrate worse metabolic profiles than gynoid patterns at equivalent total body fat.
A narrow hip circumference carries specific implications. Hips narrower than expected for the given body mass are associated with a 2- to 3-fold excess risk of diabetes after adjusting for waist circumference. Possible explanations include reduced gluteal muscle mass affecting insulin clearance, a smaller skeletal frame, or hormonal factors limiting peripheral fat storage capacity.
The WHR reveals complexity that simple visceral fat measurement misses. The ratio doesn’t distinguish between fat mass, muscle mass, and skeletal structure. It combines all three into a single value. This limitation means identical ratios may represent completely different body compositions.
WHR interpretation differs from that based solely on waist circumference. Waist captures abdominal accumulation. The hip reflects the peripheral tissue. The ratio accounts for both simultaneously, recognising their independent and opposite effects on health.
When adjusted for BMI, the relationship between waist-to-hip ratio and death appears J-shaped (a curve showing increased mortality at both very low and very high values, with an optimal range in the middle). Very low ratios predict increased mortality. Optimal values sit in a moderate range. High ratios show steep mortality increases. This pattern suggests both extremes carry risk.
Risk Thresholds Across Different Populations
Disease risk at identical waist-to-hip ratio values varies substantially across ethnic groups. Asian populations develop metabolic complications at lower measurements than Europeans.
This difference stems from differences in body composition rather than lifestyle factors. The table below presents population-specific cutoff points and risk classifications based on WHO recommendations.
Population Specific Cut Off Points
| Population/Ethnicity | Men | Women | Risk Classification |
|---|---|---|---|
| WHO General (Caucasian-based) | ≥0.90 | ≥0.85 | Substantially increased metabolic risk |
| Asian (Chinese, South Asian, Japanese) | ≥0.90 | ≥0.80 | Increased metabolic risk at lower values |
| European (Caucasian) | ≥0.90 | ≥0.85 | Reference population |
| Middle Eastern | ≥0.90 | ≥0.85 | Similar to European cut-offs |
| Mexican | 0.90 | 0.85 | Hospital population study |
| Hispanic | 0.90 to 0.91 | 0.84 to 0.86 | Metabolic risk factors |
| South American | 0.85 to 0.95 | 0.80 to 1.18 | Range from multiple studies |
| Omani | 0.91 | 0.91 | CVD risk |
| African (Sub-Saharan) | Insufficient data | Insufficient data | Protective subcutaneous fat patterns |
| Pacific Islander | Similar to European | Similar to European | Larger muscle mass considerations |
WHO established WHR cutoff points for substantially increased risk of metabolic complications as ≥0.90 for men and ≥0.85 for women. These recommendations stem primarily from Caucasian populations.
- Asian populations: Chinese and South Asian men and women exhibit greater visceral adipose tissue for a given waist circumference than Europeans do. Studies including European comparison groups indicated lower WHR values. Data suggest ≥0.90 for men and ≥0.80 for women. Asians appear to have a higher metabolic risk at lower WHR than Europeans, due to higher body fat and abdominal adipose tissue.
- Age-specific thresholds: For ages 60 to 69, health risk classification shifts upward. Men exceed the high-risk threshold at >1.03, compared with 0.95 for younger adults. Women reach high risk at >0.90, compared with 0.86 for younger ages.
- Middle Eastern, Hispanic, and South American populations: Studies of populations residing in the Middle East provided WHR cutoff points similar to those suggested for Europeans. Hispanic populations showed one study suggesting 0.90 to 0.91 for men and 0.84 to 0.86 for women. South American studies indicated values ranging from 0.85 to 0.95 in men and 0.80 to 1.18 in women.
- African populations: Only one study reported waist-to-hip ratio cutoff points for Africans. None investigated cutoff points specifically. Compared to European women, black women in South Africa have less abdominal adipose tissue at the same waist circumference. Small studies report that African women have less visceral adipose tissue than white women. Insufficient evidence exists for specific cutoffs.
- Pacific Islander considerations: Some studies have reported that Pacific Islanders have greater muscle mass and lower body fat percentages than Europeans at similar BMIs. In women, similar patterns emerge at equivalent WHR values. This complicates threshold determination.
Universal cutoffs fail because optimal cutoff points for measures of abdominal obesity vary across different ethnicities and population groups. There is no optimal cutoff point that can be applied worldwide. For a given combination of BMI and waist-to-hip ratio, risk is higher among Asians across all disease outcomes.

Improving Your Waist-to-Hip Ratio
The WHR responds through dual mechanisms: reducing waist whilst maintaining or increasing hip measurement. This differs fundamentally from simple weight loss strategies.
When people lose weight through diet and exercise, visceral fat mobilises preferentially. A 5kg weight loss typically includes 2 to 3kg from visceral depots. This preferential loss explains rapid metabolic improvements with modest weight reduction.
Targeting Visceral Fat Reduction
Lifestyle modification preferentially mobilises visceral fat. Walking 30 minutes daily burns approximately 150 calories while specifically targeting visceral fat. Studies show a reduction in waist circumference of 2-3cm over 12 weeks without dietary changes.
Replacing ultra-processed foods with whole foods reduces waist circumference by 3-5cm over 6 months. Ultra-processed foods contain added sugars, refined grains, and industrial fats, all of which promote insulin resistance and visceral fat accumulation. Each daily serving of sugar-sweetened beverages adds 0.6 to 1.0cm to waist circumference annually. Elimination reverses this accumulation.
Building Gluteal Muscle
Studies comparing aerobic exercise alone with combined aerobic and resistance training show superior outcomes with the combined approach. Waist circumference reduction reached 4.3cm with combined training versus 2.8cm with aerobic alone over 12 weeks.
Hip circumference reflects the gluteal muscle alongside pelvic width and adipose tissue. Resistance training builds gluteal development, elevating hip measurement and lowering the ratio even when the waist remains stable.
Hormonal and Behavioural Factors
Increased cortisol secretion (stress hormone released by the adrenal glands) was postulated as the underlying cause of variations in fat and muscle distribution. High waist-to-hip ratio in alcoholic men and women with Cushing syndrome (a hormonal disorder causing excess cortisol) has been attributed to wasting of leg muscle and increased visceral fat area.
Mildly increased cortisol, stress-related cortisol, and diurnal cortisol secretion (a daily rhythmic pattern of cortisol release with peaks in the morning and lows at night) are associated with increased WHR values in the general population. Increased concentrations of glucocorticoids (stress hormones) were implicated in insulin resistance and atherogenic (plaque-promoting) lipid profiles.
Sex steroid hormones drive body-composition dimorphisms (differences in form between the sexes) during pubertal development. In men, reduced free testosterone levels are associated with increased fat mass and reduced muscle mass.
High alcohol consumption, physical inactivity, and smoking were attributed to both a relatively large waist and a relatively narrow hip. These behavioural factors operate through multiple pathways affecting fat deposition and muscle maintenance.
Modest improvements produce substantial risk reduction. Reducing waist-to-hip ratio by 5 to 10cm through lifestyle modification decreases the risk of metabolic disease by 40 to 60%, even if overall weight loss is modest.
Who Should Track This Measurement
Age-related muscle loss masks fat gain when using weight or BMI alone. A 65-year-old weighing 75kg may have weighed 75kg at age 40. Body composition shifted dramatically: 8kg of muscle lost, 8 kg of fat gained. BMI remains unchanged. WHR captures this hidden deterioration. Studies tracking adults over 20 years show that the waist-to-hip ratio increases by 0.5 to 1.0cm annually despite stable weight.
- Normal-weight individuals with metabolic abnormalities: Approximately 30% of normal-BMI individuals harbour excessive visceral fat. These people appear healthy by conventional measures. Studies using CT scans reveal that 20-40% of normal-weight adults have dangerous levels of visceral adiposity. They experience cardiovascular event rates similar to those of overtly obese individuals. BMI misses this hidden risk. WHR captures it effectively.
- Asian, Hispanic, and African Caribbean populations: Asian individuals develop metabolic complications at lower WHR values than European populations. At identical BMI and waist circumference, Asian populations have 3-5% more visceral adipose tissue. This excess drives the earlier onset of metabolic disease. Using European cut-points in Asian individuals substantially underestimates disease risk.
- Family history of diabetes or CVD: Genetic predisposition interacts with central adiposity. People with a family history face a 2 to 4 times higher risk at equivalent WHR measurements compared to those without a family history. Earlier screening becomes essential.
- Postpartum women: Women experiencing gestational diabetes (diabetes during pregnancy) face a 7-fold higher lifetime type 2 diabetes risk. WHR monitoring enables early detection of progression from pre-diabetes to diabetes.
- Clinical screening vs home self-monitoring: Healthcare settings require standardised protocols for consistency across visits and practitioners. Different providers should obtain measurements within 2cm using a standardised technique. Self-monitoring at home allows trend tracking. Home measurements remain valuable provided the technique stays consistent between assessments. Research comparing clinic and home measurements shows correlations of 0.85-0.90.
Waist-to-hip ratio adds value when BMI appears normal, but metabolic abnormalities are present. The ratio identifies individuals at increased health risk across different BMI categories. Although BMI and waist circumference are correlated, the correlation between BMI and WHR is weak, suggesting that the information provided by these measures is distinct.
![]()
Reliability and Limitations of Waist-to-Hip Ratio
Technical error for hip measurements reaches 1.23cm from intrameasurer variability and 1.38cm from intermeasurer variability. These figures derive from adolescent studies but likely apply across age groups.
Trained observers following standardised protocols obtain results within 2cm. The INTERHEART study (a case-control study of myocardial infarction across 52 countries) assessed reliability across varying levels of training. Two independent observers achieved a correlation of 0.94 with a mean difference of 1.8cm.
Untrained measurers show substantially higher variability. Mean differences reach 3.2cm, with individual differences exceeding 8cm. Two-hour training reduces errors to 1-2cm.
Advantages
Simplicity and accessibility form the primary advantage. The technique requires only a flexible tape measure costing under £10. No electricity, laboratory facilities, or computer processing needed.
Waist-to-hip ratio accounts for protective gluteofemoral fat, as well as abdominal fat. This dual assessment explains higher discriminatory power in predicting cardiovascular outcomes. Studies demonstrate that WHR shows a slightly stronger association with cardiovascular events than waist measurement alone.
Evidence spans multiple continents, ethnic groups, and age ranges. Convincing evidence exists for associations with CVD risk, type 2 diabetes from prospective and cross-sectional studies, hypertension from cross-sectional data, and overall mortality with and without anthropometric parameter adjustment.
Limitations
The ratio cannot distinguish tissue components. Identical WHR values may represent completely different body compositions. Hip measurement combines subcutaneous fat, gluteal muscle, and skeletal structure into a single value. A muscular individual and someone with substantial adiposity but minimal muscle produce the same reading.
Population-specific thresholds become necessary. Universal cut-points misclassify risk in many populations. Asian individuals need thresholds 4 to 5cm lower than those of European populations. Hispanic and Latino populations show intermediate patterns. Mixed-ethnicity individuals present interpretation challenges.
Measuring hip circumference is more challenging than measuring waist circumference alone. This complexity limits potential use as an alternative to either waist circumference or BMI. Insufficient data exist on other proxy measures to suggest giving them priority.
The measurement requires technique-dependent accuracy. Improper identification of anatomical landmarks, inconsistent tape tension, or angled tape placement can substantially affect readings. Untrained assessors frequently generate errors exceeding 10cm. This technique’s sensitivity requires quality control procedures that many settings lack.
Comparison with BMI and waist circumference shows WHR correlates with BMI, but the association level varies. These measures provide different information and thus may not be interchangeable. When the waist-to-hip ratio is adjusted for BMI, the relationship with all-cause mortality appears J-shaped to almost linear.
Evidence strength classification demonstrates convincing associations with CVD risk, type 2 diabetes, hypertension, and mortality. Probable evidence supports CVD risk factors. Possible evidence suggests associations with pancreatic, endometrial, cervical, kidney, and gallbladder cancers.
The waist-to-hip ratio retains clinical value despite complexity because it captures information that waist measurement alone misses. The ratio accounts for both abdominal accumulation and peripheral tissue simultaneously, recognising their independent and opposite effects.
Sources
- Berber A, Gomez-Santos R, Fanghanel G et al. Anthropometric indexes in the prediction of type 2 diabetes mellitus, hypertension and dyslipidaemia in a Mexican population. International Journal of Obesity and Related Metabolic Disorders. 2001;25(12):1794-1799.
- Bjorntorp P. Fat cell distribution and metabolism. Annals of the New York Academy of Sciences. 1987;499:66-72.
- de Koning L, Merchant AT, Pogue J, Anand SS. Waist circumference and waist-to-hip ratio as predictors of cardiovascular events: meta-regression analysis of prospective studies. European Heart Journal. 2007;28(7):850-856.
- Derby CA, Zilber S, Brambilla D et al. Body mass index, waist circumference and waist to hip ratio and change in sex steroid hormones: the Massachusetts Male Ageing Study. Clinical Endocrinology. 2006;65(1):125-131.
- Després JP. Body fat distribution and risk of cardiovascular disease: an update. Circulation. 2012;126(10):1301–13.
- Han TS, Bijnen FC, Lean MEJ, et al. Separate associations of waist and hip circumference with lifestyle factors. Int J Epidemiol. 1998;27:422-430.
- Heyward, Vivian H. Applied body composition assessment, in Advanced fitness assessment and exercise prescription. 6th ed. Champaign, IL : Human Kinetics. 2010.
- Heyward VH, Gibson AL. Assessing body composition. In: Heyward VH, Gibson AL, editors. Advanced Fitness Assessment and Exercise Prescription. 7th ed. Champaign, IL: Human Kinetics; 2014. p. 219–65.
- Heyward VH, Wagner D. Applied Body Composition Assessment. 2nd ed. Champaign (IL): Human Kinetics; 2004. 280 p.
- Huxley R, Mendis S, Zheleznyakov E et al. Body mass index, waist circumference and waist:hip ratio as predictors of cardiovascular risk: a review of the literature. European Journal of Clinical Nutrition. 2010;64(1):16-22.
- Kvist H, Hallgren P, Jonsson L, et al. Distribution of adipose tissue and muscle mass in alcoholic men. Metabolism. 1993;42:569-573.
- Landsberg L, Young JB. Fasting, feeding and regulation of the sympathetic nervous system. N Engl J Med. 1978;298:1295-1301.
- Lapidus L, Bengtsson C, Larsson B, Pennert K, Rybo E, Sjöström L. Distribution of adipose tissue and risk of cardiovascular disease and death: a 12 year follow up of participants in the population study of women in Gothenburg, Sweden. British Medical Journal. 1984;289(6454):1257-1261.
- Larsson B, Svärdsudd K, Welin L, Wilhelmsen L, Björntorp P, Tibblin G. Abdominal adipose tissue distribution, obesity, and risk of cardiovascular disease and death: 13 year follow up of participants in the study of men born in 1913. British Medical Journal. 1984;288(6428):1401-1404.
- Lohman T, Roche A, Martorell R. Anthropometric standardisation reference manual. Champagne, Illinois, Human Kinetic Books, 1988.
- Lönn L, Kvist H, Ernest I, et al. Changes in body composition and adipose tissue distribution after treatment of women with Cushing’s syndrome. Metabolism. 1994;43:1517-1522.
- Marin P, Darin N, Amemiya T, et al. Cortisol secretion in relation to body fat distribution in obese premenopausal women. Metabolism. 1992;41:882-886.
- Pischon T, Boeing H, Hoffmann K et al. General and abdominal adiposity and risk of death in Europe. New England Journal of Medicine. 2008;359(20):2105-2120.
- Qiao Q, Nyamdorj R. The optimal cutoff values and their performance of waist circumference and waist-to-hip ratio for diagnosing type II diabetes. European Journal of Clinical Nutrition. 2010b;64(1):23-29.
- Rush EC, Goedecke JH, Jennings C et al. BMI, fat and muscle differences in urban women of five ethnicities from two countries. International Journal of Obesity. 2007;31(8):1232-1239.
- Sahakyan KR, Somers VK, Rodriguez-Escudero JP, et al. Normal-weight central obesity: implications for total and cardiovascular mortality. Ann Intern Med. 2015;163(11):827–35.
- Seidell JC. Waist circumference and waist/hip ratio in relation to all-cause mortality, cancer and sleep apnea. European Journal of Clinical Nutrition. 2010;64(1):35-41.
- Seidell JC, Han TS, Feskens EJM, et al. Narrow hips and broad waist circumferences independently contribute to increased risk of non-insulin-dependent diabetes mellitus. J Intern Med. 1997;242:401-406.
- Seidell JC, Pérusse L, Després JP, Bouchard C. Waist and hip circumferences have independent and opposite effects on cardiovascular disease risk factors: the Quebec Family Study. Am J Clin Nutr. 2001 Sep;74(3):315-21.
- Tchernof A, Despres JP. Pathophysiology of human visceral obesity: an update. Physiol Rev. 2013;93(1):359–404.
- World Health Organization. Waist Circumference and Waist–Hip Ratio: Report of A WHO Expert Consultation, Geneva, 8–11 December 2008.
- Yusuf S, Hawken S, Ounpuu S et al. Obesity and the risk of myocardial infarction in 27,000 participants from 52 countries: a case-control study. Lancet. 2005;366(9497):1640-1649.
CONNECT WITH BESUND
LATEST ARTICLES
- Your Ad Here -