

Waist and hip circumferences don’t simply measure body size. They encode opposing biological signals that independently determine disease risk, independent of total body weight. A 1984 Swedish discovery exposed this paradox: scientists tracking 792 men for 13 years found body weight failed to predict who died from heart disease, whilst the ratio between waist and hip circumferences succeeded.
The finding emerged from data showing zero association between body mass index (BMI) and myocardial infarction (heart attack caused by blocked blood flow to heart muscle), stroke, or premature death. Yet the waist and hip ratio identified every high-risk individual. Women’s data confirmed it. This wasn’t measurement error or statistical noise. Two circumferences working against each other revealed information that the total mass concealed.
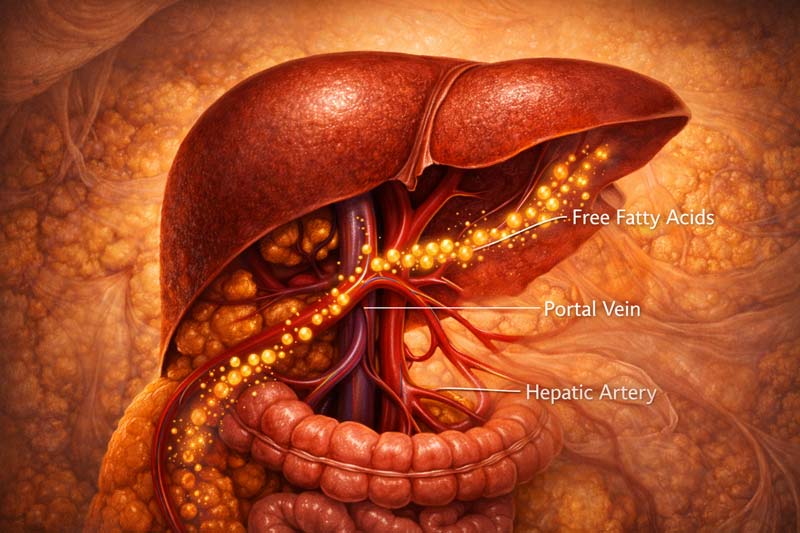
The mechanism explains why. Visceral fat around the waist drains directly into the portal vein (the major blood vessel that carries nutrients from the digestive organs to the liver), exposing liver tissue to high fatty acid concentrations. This triggers insulin resistance (a reduced cellular response to insulin), dyslipidaemia (abnormal lipid levels in the blood), and hypertension (elevated blood pressure).
Meanwhile, gluteofemoral fat at the hips demonstrates protective metabolic properties: high lipoprotein lipase activity (an enzyme that breaks down fats for storage), low fatty acid turnover (minimal release back into the bloodstream), and favourable adipokine secretion (hormone-like proteins from fat tissue).
The ratio captures both signals simultaneously. Someone with a 95cm waist and 95cm hip faces a different cardiovascular risk than someone with a 105cm waist and 95cm hip, despite identical ratios. The first might be lean with athletic muscle development. The second carries excess visceral adiposity. Same number, opposite health trajectories.
Swedish researchers didn’t set out to revolutionise obesity assessment. They expected weight to matter. Decades of insurance data suggested that heavier people died younger. Yet when they isolated abdominal fat distribution, traditional obesity measures collapsed. The waist-to-hip ratio (WHR) emerged as the only predictor standing.
Subsequent research revealed why: waist and hip circumferences have independent and opposite effects on cardiovascular disease risk factors. A higher waistline increases risk through a combination of biological processes. Higher hip decreases risk through protective fat storage.
The body distributes adipose tissue in response to sex hormones, genetics, and lifestyle factors. Where that tissue sits determines metabolic consequences. Want the exact method and cut-offs? Read our complete waist-to-hip ratio guide.
Here, we examine the biological mechanisms driving these opposing effects, the historical discovery that forced researchers to reconsider obesity itself, and the clinical reality that identical measurements can represent completely different body compositions and disease risks.
The 1984 Discovery That Body Weight Couldn’t Predict
Scientists in Gothenburg, Sweden, initiated two population studies that would fundamentally alter how medicine understands the risk of obesity-related diseases. The studies tracked individuals born in 1913 through middle age into their late 60s and 70s.
Researchers measured everything: body weight, height, waist circumference, hip circumference, blood pressure, cholesterol, and smoking habits. Then they waited. Over 13 years for men, 12 for women. Deaths occurred. Heart attacks struck. Stroke survivors are disabled. The question: which baseline measurements predicted these outcomes?
Body weight showed nothing. BMI revealed no association. The researchers checked their data repeatedly. Insurance companies had built entire actuarial tables on the premise that heavier people died younger. Yet in this cohort, body mass failed utterly as a predictor of cardiovascular death.
The WHR succeeded where total obesity measures failed. The findings emerged across four key observations:
- Study Design and Scale: The male cohort enrolled 792 men born in 1913, examined at age 54, followed through age 67. Researchers recorded 111 deaths during follow-up, including 48 from myocardial infarction and 20 from stroke. The female cohort tracked 1,462 women aged 38-60 years at baseline, documenting 25 myocardial infarctions and 12 strokes over 12 years. Both studies achieved >95% follow-up completion, thereby eliminating selection bias from participants who were lost to follow-up.
- BMI Complete Failure: Statistical analysis revealed that neither body weight nor BMI was associated with cardiovascular deaths. Men in the highest BMI quartile (the heaviest 25%) had identical mortality rates to those in the lowest quartile. Women demonstrated the same pattern. This contradicted four decades of epidemiological research (population-level disease-pattern studies) suggesting obesity increased cardiovascular risk.
- Ratio Prediction Success: Men with a WHR above 1.00 faced dramatically elevated risk for myocardial infarction, stroke, and premature death compared to men with a WHR below 0.90. Women with ratios above 0.85 showed similar patterns. The association remained after adjusting for smoking, blood pressure, and cholesterol. Abdominal fat distribution was independently associated with risk.
- Mechanistic Implications: The findings forced researchers to reconsider the nature of obesity itself. Total adipose mass clearly mattered less than fat distribution. Abdominal adiposity carried unique metabolic consequences that peripheral fat did not. The waist and hip measurements captured this distribution difference better than body weight could.
Women’s data provided crucial confirmation. Female fat distribution differs from that of males due to the effects of oestrogen (the primary female sex hormone that promotes peripheral fat storage) and progesterone (a hormone that supports pregnancy and influences fat deposition patterns).
Yet the protective effect of hip circumference was observed in both sexes. Higher hip measurements, after controlling for waist and total body mass, are associated with reduced cardiovascular risk. This suggested gluteofemoral adiposity (fat stored around the hips and thighs) served protective metabolic functions regardless of sex hormones.
The Swedish papers triggered immediate controversy. Obesity researchers questioned whether the waist-to-hip ratio truly outperformed BMI or whether the finding represented a statistical artefact. Replication studies in Dutch, British, and American populations confirmed the Swedish results.
Abdominal fat distribution predicted cardiovascular events better than total body mass across diverse populations. The measurement itself, waist circumference divided by hip circumference, became standard in obesity research and clinical assessment.
Yet the ratio itself created interpretive challenges. A high WHR could reflect either increased waist circumference, decreased hip circumference, or both. These conditions carried different implications. Increased waist signalled visceral fat accumulation. Decreased hip girth might indicate muscle wasting from inactivity, malnutrition, or cortisol excess (a stress hormone that redistributes fat from limbs to the abdomen). The ratio confounded these distinct biological processes into a single number.
Modern analysis recognises that waist and hip circumferences provide independent information when considered separately rather than as a ratio. Statistical models that include both measurements predict cardiovascular events more accurately than either measurement alone or their ratio. The 1984 discovery wasn’t that ratios matter; it was that ratios matter. It was that waist and hip circumferences encode opposing disease signals that total body weight cannot detect.
Why Waist and Hip Work in Opposite Directions
The Quebec Family Study examined 200 adults across multiple generations, measuring body composition using computed tomography (a form of X-ray imaging that creates detailed cross-sectional images of internal structures), metabolic markers, and circumferences.
Researchers found that waist circumference is positively associated with insulin resistance, triglycerides (blood fats linked to heart disease), and blood pressure. Hip circumference is negatively associated with these risk factors. The effects operated independently; controlling for one measurement didn’t eliminate the association with the other. Two anatomical sites storing adipose tissue produced opposite metabolic consequences.
The mechanism stems from where fat drains and how it behaves. Visceral adipocytes (fat cells in the abdominal cavity surrounding organs) differ fundamentally from subcutaneous gluteofemoral adipocytes (fat cells beneath the skin in the buttocks and thigh regions). These differences create opposing health effects, as captured by waist and hip measurements.
The Waist Effect
Abdominal visceral fat sits inside the peritoneal cavity (membrane-lined space containing digestive organs), surrounding the liver, intestines, and pancreas. This anatomical position determines its metabolic impact.
Visceral adipocytes release fatty acids directly into the portal vein, the major blood vessel draining digestive organs to the liver. Portal venous blood delivers these fatty acids straight to hepatocytes (liver cells responsible for metabolism and detoxification) at high concentrations.
Elevated portal fatty acids impair hepatic insulin uptake. The liver extracts typically 50-80% of insulin from portal blood before it reaches systemic circulation. High fatty acid exposure reduces this extraction, leading to peripheral hyperinsulinaemia (excessive insulin in the bloodstream).
Skeletal muscle and adipose tissue then develop insulin resistance as a compensatory response. This triggers a metabolic cascade: impaired glucose tolerance (reduced ability to process blood sugar), elevated triglycerides, reduced high-density lipoprotein cholesterol (a protective cholesterol that removes fats from arteries), and hypertension.
The portal fatty acid hypothesis explains why abdominal obesity causes metabolic dysfunction (the body’s systems for blood sugar, fat, and energy regulation not working correctly), whilst peripheral obesity does not.
Subcutaneous fat in arms, legs, or hips drains into systemic veins. By the time these fatty acids reach the liver, blood volume dilutes them. The liver sees lower concentrations. Hepatic insulin extraction remains normal. The metabolic cascade doesn’t trigger.
Visceral adipocytes also demonstrate higher lipolytic activity (rate of breaking down stored fat into fatty acids) compared to peripheral fat cells. They’re more sensitive to catecholamines (stress hormones like adrenaline that mobilise stored energy) and less sensitive to insulin’s anti-lipolytic effects. This means visceral fat releases fatty acids more readily during stress or fasting. The liver gets repeatedly exposed to fatty acid surges that peripheral fat doesn’t produce.
The Hip Effect
Gluteofemoral adipocytes function as long-term energy storage with protective metabolic properties. These fat cells demonstrate high lipoprotein lipase activity, the enzyme responsible for capturing triglycerides from circulating lipoproteins (particles that carry fats through the blood) for storage.
Once stored, gluteofemoral fat resists mobilisation. It exhibits low hormone-sensitive lipase activity (an enzyme that breaks down stored fat), making it challenging to release fatty acids even during caloric restriction.
This storage-retention pattern protects metabolic health. Fat sequestered in the hips and thighs doesn’t flood portal circulation with fatty acids. The liver maintains normal insulin extraction. Peripheral tissues avoid compensatory insulin resistance. Blood lipid profiles remain favourable because triglycerides are efficiently stored rather than circulating chronically.
Gluteofemoral fat also secretes beneficial adipokines. Higher hip circumference associates with elevated adiponectin (a hormone that increases insulin sensitivity and reduces inflammation) and leptin (a hormone regulating appetite and energy expenditure) levels.
Lower levels of pro-inflammatory cytokines, such as tumour necrosis factor-alpha and interleukin-6, are found in gluteofemoral depots compared with visceral fat. This creates an anti-inflammatory metabolic environment that protects against atherosclerosis (arterial wall thickening from plaque buildup) and diabetes.
The sex difference in fat distribution reflects these protective effects. Women store proportionally more fat in hips and thighs due to oestrogen and progesterone. This protects premenopausal women from cardiovascular disease despite higher total body fat percentages compared to men. After menopause, declining oestrogen levels (a female sex hormone) shift fat distribution towards abdominal deposition. Cardiovascular risk increases correspondingly.
The WHR captures this dual signal. Higher ratios indicate either excess visceral fat, insufficient gluteofemoral fat, or both. Lower ratios suggest a favourable distribution regardless of total adiposity. Someone carrying substantial hip fat can tolerate moderate waist fat without metabolic consequences. The protective gluteofemoral depot buffers against the harmful effects of visceral fat by efficiently capturing and storing circulating lipids.
This explains why identical total body fat percentages produce different health outcomes based on distribution. A person with 30% body fat concentrated in the hips and thighs faces lower cardiovascular risk than someone with 25% body fat concentrated abdominally. The waist and hip measurements reveal this distribution difference that body weight and BMI cannot detect.
The Waist Signal: Portal Vein Fatty Acid Exposure
Visceral adipose tissue sits deep inside the abdomen, in the space between organs. Subcutaneous fat sits under the skin, but visceral fat hugs the intestines, liver, and pancreas inside the peritoneal cavity.
That location changes where its blood goes. The portal vein collects blood from the digestive organs, then sends it straight to the liver before it reaches the wider circulation. Visceral fat drains into that same portal system, so fatty acids released from abdominal fat cells hit liver cells first, and at high concentration.
The metabolic cascade triggered by portal fatty acid exposure operates through several distinct mechanisms:
- Portal fatty acids inhibit hepatic insulin clearance.
The liver extracts typically 50-80% of insulin from portal blood. High fatty acid concentrations impair this extraction. Insulin that should be removed instead enters the systemic circulation, causing peripheral hyperinsulinaemia (elevated insulin levels throughout the body). Muscle and adipose tissue respond by developing insulin resistance as a protective mechanism against excessive insulin signalling.
- Hepatic triglyceride production accelerates.
Fatty acids delivered to liver cells are repackaged into very-low-density lipoprotein particles (VLDL), which transport triglycerides through the bloodstream. Excess portal fatty acids increase VLDL production, raising blood triglycerides. High triglycerides associate with reduced HDL cholesterol (protective fat particles that remove cholesterol from arteries) and increased small, dense LDL particles (harmful cholesterol form that easily penetrates arterial walls). This creates atherogenic dyslipidaemia (a blood fat pattern that promotes arterial disease).
- Hepatic glucose production increases despite hyperinsulinaemia. The liver maintains blood glucose levels by producing it from glycogen (a stored glucose polymer) and amino acids (protein building blocks). Insulin normally suppresses this gluconeogenesis (glucose production from non-carbohydrate sources). However, fatty acid-induced insulin resistance means the liver fails to respond to insulin’s signal. It continues producing glucose even when blood glucose already runs high. This drives fasting hyperglycaemia (elevated blood sugar after an overnight fast) and eventual diabetes.
- Systemic insulin resistance develops across peripheral tissues.
Muscle cells exposed to chronic hyperinsulinaemia reduce insulin receptor density (proteins on the cell surface that bind insulin) and downstream signalling. They become resistant to insulin’s signal for glucose uptake. This forces the pancreas to produce even more insulin, creating a vicious cycle. Adipocytes similarly develop insulin resistance, reducing their ability to store incoming fatty acids and triglycerides.
- Blood pressure elevation occurs through multiple pathways. Hyperinsulinaemia increases renal sodium retention (kidneys hold onto salt), expanding blood volume. Insulin also activates the sympathetic nervous system (the fight-or-flight stress response), increasing heart rate and arterial wall tension (vascular tone). Combined with endothelial dysfunction (damage to the blood vessel lining) caused by high circulating fatty acids and glucose, these effects chronically elevate blood pressure.
The portal hypothesis explains several clinical observations:
- First, why does computed tomography-measured visceral fat volume predict cardiovascular disease better than total abdominal fat? Subcutaneous abdominal fat contributes to waist circumference but drains into systemic veins. It doesn’t expose the liver to concentrated fatty acids. Only visceral fat produces the portal fatty acid surge.
- Second, why does the surgical removal of subcutaneous abdominal fat through liposuction not improve metabolic markers? The procedure removes substantial fat mass from the waist region but leaves visceral depots untouched. Portal fatty acid delivery continues unchanged. Insulin resistance, dyslipidaemia, and hypertension persist despite reduced waist circumference.
- Third, why does exercise reduce visceral fat preferentially? Physical activity increases catecholamine (stress hormone) release, which mobilises visceral fat more readily than subcutaneous depots. Regular exercise reduces portal fatty acid exposure even before substantial weight loss occurs. Metabolic improvements appear rapidly, within weeks, whilst waist circumference decreases more gradually.
The strength of visceral fat’s metabolic impact depends on individual variation in portal vein anatomy and hepatic fatty acid metabolism. Some individuals tolerate moderate visceral adiposity without developing insulin resistance. Others demonstrate metabolic dysfunction with minimal visceral accumulation. Genetic factors that determine hepatic lipid-handling capacity create this variability.
Ethnicity influences visceral fat accumulation and its metabolic consequences. South Asian and East Asian populations develop visceral adiposity at lower BMIs than European populations. They demonstrate metabolic dysfunction at waist circumferences that wouldn’t raise concern in Caucasians. This reflects both genetic predisposition to central fat deposition and reduced capacity for subcutaneous fat storage.
The waist measurement captures visceral fat accumulation imperfectly. Subcutaneous abdominal fat contributes substantially to waist circumference in some individuals, particularly women. Computed tomography or magnetic resonance imaging provides direct visceral fat quantification but remains impractical for routine screening. Waist circumference serves as a proxy measure that correlates reasonably well with visceral volume across populations, whilst remaining inexpensive and straightforward.

The Hip Signal: Protective Gluteofemoral Storage
Gluteofemoral adipose tissue, the fat stored in the buttocks and thighs, exhibits metabolic properties opposite to those of visceral depots. Whilst abdominal fat drives insulin resistance and dyslipidaemia, hip and thigh fat protects against these conditions. The protection operates through three distinct mechanisms. These relate to how the tissue captures fat, stores it, and signals to the rest of the body.
Metabolic Activity
Gluteofemoral adipocytes express exceptionally high lipoprotein lipase activity compared to visceral or even upper-body subcutaneous fat. Lipoprotein lipase sits on the surface of fat cells, breaking down triglyceride-rich lipoproteins circulating in the blood. It releases fatty acids that adipocytes then absorb and store. Higher enzyme activity means hip fat efficiently captures circulating lipids that might otherwise deposit in the liver, muscle, or arterial walls.
This explains why individuals with substantial hip fat often maintain favourable blood lipid profiles despite high total body fat percentage. Their gluteofemoral depots act as metabolic sinks, continuously pulling triglycerides from circulation into safe storage. Liver and muscle tissues avoid lipid accumulation that would impair their function. The phenomenon is particularly pronounced in premenopausal women, in whom oestrogen enhances gluteofemoral lipoprotein lipase expression.
Sex hormones regulate this activity powerfully. Oestrogen and progesterone upregulate lipoprotein lipase in hip and thigh adipocytes whilst simultaneously suppressing it in abdominal depots. This creates the characteristic gynoid (pear-shaped) fat distribution in women.
Men with lower oestrogen and higher testosterone show opposite regulation: higher abdominal lipoprotein lipase and lower gluteofemoral activity. This produces an android (apple-shaped) distribution and explains men’s higher cardiovascular disease risk at equivalent body fat percentages.
Storage Behaviour
Once fatty acids enter gluteofemoral adipocytes, they resist mobilisation. These cells exhibit low hormone-sensitive lipase activity, the enzyme that breaks down stored triglycerides into fatty acids. Even during caloric restriction or exercise, gluteofemoral fat releases fatty acids more slowly than visceral or abdominal subcutaneous depots.
This tenacity in storage frustrates individuals trying to lose hip fat through diet and exercise. Lower-body fat is the last to be mobilised and the first to be restored during weight cycling. Yet this biochemical stubbornness serves protective metabolic functions. Stable gluteofemoral fat storage prevents chronic fatty acid elevation in portal or systemic circulation. The liver maintains normal insulin extraction. Muscle tissues avoid lipid-induced insulin resistance.
The stability reflects adipocyte biology. Gluteofemoral fat cells demonstrate a larger average size, greater lipid storage capacity, and reduced turnover compared to visceral adipocytes. They function as long-term energy reserves rather than dynamic metabolic regulators. This contrasts sharply with visceral fat, where small, metabolically active cells constantly release and reabsorb fatty acids in response to hormonal signals.
Interestingly, individuals who lose substantial weight demonstrate preferential reduction in visceral rather than gluteofemoral fat. A person losing 10kg might see 4-5kg come from abdominal visceral depots but only 1-2kg from hips and thighs. This distribution pattern produces marked metabolic improvements despite modest changes in overall body shape. The WHR improves substantially even when total weight loss appears limited.
Hormone Signalling
Gluteofemoral adipocytes secrete adipokines with beneficial metabolic effects. Higher hip circumference is associated with higher circulating adiponectin levels. This hormone increases insulin sensitivity in the liver and muscle whilst reducing hepatic glucose production.
Adiponectin also exerts anti-inflammatory effects on the vascular endothelium (the lining of blood vessels), helping protect against atherosclerosis. Visceral fat produces minimal adiponectin despite secreting large amounts of pro-inflammatory cytokines.
Leptin secretion patterns also differ. Although both visceral and subcutaneous fat produce leptin in proportion to their mass, gluteofemoral adipocytes appear more sensitive to insulin’s stimulatory effects on leptin production. This may help explain why individuals with predominantly lower-body fat distribution maintain better appetite regulation and energy balance compared to those with visceral obesity.
The inflammatory profile distinguishes gluteofemoral from visceral fat most dramatically. Hip adipocytes produce low levels of tumour necrosis factor-alpha, interleukin-6, and other pro-inflammatory cytokines, whereas visceral depots secrete them abundantly.
They also express higher levels of anti-inflammatory factors, such as interleukin-10. This creates a systemically anti-inflammatory environment that protects vascular health and reduces the risk of diabetes.
Research using adipose tissue biopsies confirms these differences at the molecular level. Gluteofemoral fat shows distinct gene expression patterns compared to abdominal depots. Genes involved in lipid storage, adiponectin production, and insulin sensitivity show higher activity. Genes related to inflammation, lipolysis, and cortisol generation show lower activity. These expression differences persist even when comparing fat from the same individual, indicating depot-specific programming rather than systemic factors.
Clinical observations support the protective effect. Women with polycystic ovary syndrome who maintain gynoid fat distribution despite elevated androgens (male hormones) show better metabolic profiles than those shifting towards android patterns. Similarly, men who retain some gluteofemoral fat demonstrate lower cardiovascular risk compared to those with exclusively abdominal adiposity, even at identical total body fat percentages.
The hip circumference measurement captures this protective depot imperfectly. It includes both adipose tissue and gluteal muscle mass. Individuals with well-developed gluteus maximus (the largest buttock muscle) may show large hip circumferences without substantial fat mass.
Conversely, someone with poor muscle development but significant gluteofemoral adiposity might demonstrate modest hip measurements. This measurement limitation explains some of the variability in how hip circumference predicts metabolic outcomes across populations.

Why Waist and Hip Changes Reveal Different Risks
Two individuals walk into a clinic with an identical WHR of 0.95. The first: 95cm waist, 100cm hip. The second: 105cm waist, 110cm hip. Same ratio. Different risk profiles entirely.
The first person might be a formerly athletic individual who maintained hip muscle mass whilst developing modest visceral adiposity through sedentary middle age. Computed tomography would likely show limited visceral fat volume relative to their waist circumference, alongside substantial subcutaneous abdominal fat and preserved gluteal muscle. Their metabolic profile, insulin sensitivity, blood lipids, and inflammatory markers might fall within normal ranges despite the elevated ratio.
The second adds an additional 10cm to the abdominal circumference. That expansion reflects visceral fat accumulation. Portal fatty acid delivery runs higher. Hepatic insulin resistance develops more readily. Their blood work likely shows elevated triglycerides, reduced HDL cholesterol, and impaired fasting glucose. Blood pressure trends upward. The extra 10cm at the waist drives metabolic dysfunction that the proportionally larger hip cannot fully compensate for.
Clinical populations show this variability clearly. Patients with Cushing syndrome, a condition that causes chronic cortisol excess, develop a distinctive pattern of body composition change.
Cortisol shifts fat from peripheral to central depots and accelerates muscle breakdown. The result is a high waist-to-hip ratio driven by both an expanding waist (visceral fat gain) and a shrinking hip (gluteal muscle loss). Their ratio might match that of someone with simple abdominal obesity, but the biology underlying it is entirely different.
Alcoholic men demonstrate similar patterns. Chronic alcohol consumption elevates cortisol secretion whilst impairing peripheral muscle protein synthesis. The result: central fat deposition combined with leg and gluteal muscle loss. Waist-to-hip ratio increases through both mechanisms. These patients develop metabolic syndrome at ratios that wouldn’t predict risk in individuals with preserved muscle mass.
The ratio confounds fat accumulation with muscle loss. A declining hip circumference over time might signal sarcopenia (age-related muscle loss), physical inactivity, or nutritional deficiency rather than favourable fat redistribution. An individual losing muscle mass from their hips and thighs whilst maintaining a stable waist circumference will show rising WHR despite unchanged visceral adiposity. Their cardiovascular risk increases not from fat gain but from muscle loss and its associated metabolic consequences.
Weight change patterns reveal these distinctions. During weight gain, men typically add more centimetres to their waists than to their hips, thereby substantially increasing their waist-to-hip ratio. A 4.5kg gain might produce 4cm waist expansion but only 2.5cm hip increase. Women show more balanced expansion: 3.3cm waist, 3.6cm hip for equivalent weight gain. The ratio increases less in women, reflecting oestrogen’s protective effect on fat distribution.
During weight loss, the pattern reverses asymmetrically. Visceral fat mobilises preferentially compared to gluteofemoral depots. Someone losing 10kg might see the waist circumference drop by 8-10cm, whilst the hips decrease by only 3-4cm. The waist-to-hip ratio improves dramatically despite modest overall weight loss. This explains why metabolic markers normalise rapidly with even moderate weight reduction; the visceral component drops disproportionately.
Ethnic variation complicates interpretation further. South Asian individuals develop visceral adiposity at lower BMIs and smaller waist circumferences than Europeans.
A South Asian person with a 90cm waist might carry the same visceral fat volume as a European with a 100cm waist. Their WHR would suggest different risk levels, but metabolic dysfunction appears similar across them. The ratio works differently across populations because visceral fat accumulation patterns vary.
Age modifies the relationship between ratio and risk. Older adults naturally lose muscle mass in their hips and thighs while accumulating abdominal fat. A 70-year-old with a ratio of 0.98 faces a different risk than a 40-year-old with identical measurements. The older individual likely has less total adiposity but worse distribution due to sarcopenia. Risk prediction models that account for age demonstrate better accuracy than the ratio alone.
Parity in women introduces another confounding factor. Each pregnancy is associated with approximately a 1cm reduction in hip and thigh circumference, independent of weight change. Women who have borne multiple children show smaller hip measurements than nulliparous women of equivalent body mass and age. This shifts WHR upward without necessarily indicating increased visceral adiposity or metabolic risk.
Physical activity patterns create divergent body compositions at identical ratios. Endurance athletes often maintain low waist circumferences and modest hip measurements due to minimal gluteal muscle hypertrophy (muscle growth).
Strength athletes develop substantial gluteal and thigh muscles, producing large hip circumferences that reduce their ratios even with moderate waist measurements. The metabolic implications differ completely despite similar ratio values.
The ratio itself cannot distinguish these scenarios. It collapses multiple biological processes, visceral fat accumulation, gluteofemoral fat storage, muscle mass distribution, and skeletal frame size into a single dimensionless number.
This makes interpretation dependent on knowing the individual’s composition, history, and context. A rising ratio over time within the same person provides more meaningful information than a cross-sectional comparison between individuals.
Statistical models that include waist and hip circumference as separate variables predict cardiovascular events more accurately than models that use the waist-to-hip ratio. A 2013 systematic review identified five studies comparing prediction models. In each case, including both circumferences independently outperformed using the ratio. The independent effects, waist increasing risk and hip decreasing it, carry information that the ratio hides by combining them.
This doesn’t invalidate the waist-to-hip ratio as a clinical tool. It remains useful for population screening and risk stratification when a more detailed assessment isn’t feasible. The ratio correlates with cardiovascular events across diverse populations despite its interpretive limitations. It captures fat distribution information that BMI completely misses. The 1984 Swedish discovery demonstrated this convincingly.
Yet understanding the limitations of the ratios matters for individual assessment. Two people with identical ratios do not necessarily face equivalent risk. The underlying composition, how much visceral fat, how much muscle, and what drove recent changes, determines the real metabolic consequences. Context is what turns an abstract number into a meaningful health indicator.
Sources
- Allison DB, Paultre F, Goran MI, Poehlman ET, Heymsfield SB. Statistical considerations regarding the use of ratios to adjust data. International Journal of Obesity and Related Metabolic Disorders. 1995;19:644-652.
- Björntorp P. The regulation of adipose tissue distribution in humans. Int J Obes Relat Metab Disord. 1996 Apr;20(4):291-302.
- Björntorp P. Fat cell distribution and metabolism. Annals of the New York Academy of Sciences. 1987;499:66-72.
- Cameron AJ, Magliano DJ, Söderberg S. A systematic review of the impact of including both waist and hip circumference in risk models for cardiovascular diseases, diabetes and mortality. Obesity Reviews. 2013;14:86-94.
- Camhi SM, Bray GA, Bouchard C, Greenway FL, Johnson WD, Newton RL, Ravussin E, Ryan DH, Smith SR, Katzmarzyk PT. The relationship of waist circumference and BMI to visceral, subcutaneous, and total body fat: sex and race differences. Obesity. 2011;19(2):402-408.
- Carlson LA, Boberg J, Högstedt B. Some physiological and clinical implications of lipid mobilisation from adipose tissue. In: Renold AE, Cahill GF, editors. Handbook of Physiology. Section V. Adipose Tissue. Baltimore, Maryland: Williams & Wilkins Co; 1965. p. 625-644.
- Chowdhury B, Lantz H, Sjöström L. Computed tomography-determined body composition in relation to cardiovascular risk factors in Indian and matched Swedish males. Metabolism. 1996;45:634-644.
- de Koning L, Merchant AT, Pogue J, Anand SS. Waist circumference and waist-to-hip ratio as predictors of cardiovascular events: meta-regression analysis of prospective studies. European Heart Journal. 2007;28(7):850-856.
- Derby CA, Zilber S, Brambilla D, Morales KH, McKinlay JB. Body mass index, waist circumference and waist to hip ratio and change in sex steroid hormones: the Massachusetts Male Ageing Study. Clinical Endocrinology. 2006;65(1):125-131.
- Heyward VH, Wagner D. Applied Body Composition Assessment. 2nd ed. Champaign (IL): Human Kinetics; 2004. 280 p.
- Klein S, Fontana L, Young VL, Coggan AR, Kilo C, Patterson BW, Mohammed BS. Absence of an effect of liposuction on insulin action and risk factors for coronary heart disease. New England Journal of Medicine. 2004;350:2549-2557.
- Kvist H, Hallgren P, Jonsson L, Pettersson P, Sjöström L, Sjöström D, Björntorp P. Distribution of adipose tissue and muscle mass in alcoholic men. Metabolism. 1993;42:569-573.
- Landsberg L, Young JB. Fasting, feeding and regulation of the sympathetic nervous system. New England Journal of Medicine. 1978;298:1295-1301.
- Lapidus L, Bengtsson C, Larsson B, Pennert K, Rybo E, Sjöström L. Distribution of adipose tissue and risk of cardiovascular disease and death: a 12 year follow up of participants in the population study of women in Gothenburg, Sweden. British Medical Journal (Clinical Research Edition). 1984 November 10;289(6454):1257-1261.
- Larsson B, Svärdsudd K, Welin L, Wilhelmsen L, Björntorp P, Tibblin G. Abdominal adipose tissue distribution, obesity, and risk of cardiovascular disease and death: 13 year follow up of participants in the study of men born in 1913. British Medical Journal (Clinical Research Edition). 1984 May 12;288(6428):1401-1404.
- Lassek WD, Gaulin SJ. Changes in body fat distribution in relation to parity in American women: a covert form of maternal depletion. American Journal of Physical Anthropology. 2006;131(2):295-302.
- Lear SA, Humphries KH, Kohli S, Chockalingam A, Frohlich JJ, Birmingham CL. Visceral adipose tissue accumulation differs according to ethnic background: results of the Multicultural Community Health Assessment Trial (M-CHAT). American Journal of Clinical Nutrition. 2007;86(2):353-359.
- Marin P, Darin N, Amemiya T, Andersson B, Jern S, Björntorp P. Cortisol secretion in relation to body fat distribution in obese premenopausal women. Metabolism. 1992;41:882-886.
- Molarius A, Seidell JC, Sans S, Tuomilehto J, Kuulasmaa K. Waist and hip circumferences, and waist-hip ratio in 19 populations of the WHO MONICA Project. International Journal of Obesity and Related Metabolic Disorders. 1999;23:116-125.
- Ross R, Dagnone D, Jones PJ, Smith H, Paddags A, Hudson R, Janssen I. Reduction in obesity and related comorbid conditions after diet-induced weight loss or exercise-induced weight loss in men. Annals of Internal Medicine. 2000;133:92-103.
- Seidell JC, Björntorp P, Sjöström L, Kvist H, Sannerstedt R. Regional distribution of muscle and fat mass in men—new insight into the risk of abdominal obesity using computed tomography. International Journal of Obesity. 1989;13:289-303.
- Seidell JC, Bouchard C. Visceral fat in relation to health: is it a major culprit or simply an innocent bystander? International Journal of Obesity and Related Metabolic Disorders. 1997;21:626-631.
- Seidell JC, Han TS, Feskens EJM, Lean MEJ. Narrow hips and broad waist circumferences independently contribute to increased risk of non-insulin-dependent diabetes mellitus. Journal of Internal Medicine. 1997;242:401-406.
- Seidell JC, Pérusse L, Després JP, Bouchard C. Waist and hip circumferences have independent and opposite effects on cardiovascular disease risk factors: the Quebec Family Study. American Journal of Clinical Nutrition. 2001 September;74(3):315-321.
- Shimokata H, Tobin JD, Muller DC, Elahi D, Coon PJ, Andres R. Studies in the distribution of body fat: I. Effects of age, sex, and obesity. Journal of Gerontology. 1989;44(2):M66-73.
- Tchernof A, Després JP. Pathophysiology of human visceral obesity: an update. Physiological Reviews. 2013;93(1):359-404.
- Wajchenberg BI, Bosco A, Marone MM, Levin S, Rocha M, Lerario AC, Nery M, Goldman J, Liberman B. Estimation of body fat and lean tissue distribution by dual X-ray absorptiometry and abdominal body fat evaluation by computed tomography in Cushing’s disease. Journal of Clinical Endocrinology and Metabolism. 1995;80:2791-2794.
